| Alert Name | Description |
|---|---|
| authGetTokenFail | Fail get token for service error rate is heightened on instance over last 3 min |
| clusterCpuUsageCritical | CPU usage on instance is higher than 90% for 8 min |
| clusterCpuUsageWarning | CPU usage on instance is higher than 70% for 8 min |
| clusterMemoryUsageCritical | Memory usage on the cluster is higher than 90% for 5 min |
| clusterMemoryUsageWarning | Memory usage on the cluster is higher than 75% for 5 min |
| clusterMemoryUsageLowInfo | Memory usage on the cluster is lower than 60% for 15 min |
| daemonSetMisscheduledNumberHigh | Number of misscheduled pods is high in cluster for DaemonSet for 7 min |
| daemonSetReadyNumberLow | Number of ready pods is low in cluster for DaemonSet for 7 min |
| daemonSetScheduledNumberLow | Number of scheduled pods is low in cluster for DaemonSet for 7 min |
| deploymentAvailableNumberLow | Number of available replicas is low in cluster for Deployment for 7 min |
| deploymentReplicaNumberLow | Number of replicas is low in cluster for Deployment for 7 min |
| deploymentUnavailableNumberHigh | Number of unavailable replicas is high in cluster for Deployment for 7 min |
| etcdInstanceIsLagging | etcd instance in cluster has significant difference between applied and committed transactions |
| etcdInstanceDown | etcd instance is down for over 1 min in cluster |
| etcdLeaderChangesTooOften | etcd cluster leader changed more than 3 times in 1 hour |
| etcdHighNumberOfFailedProposals | etcd cluster has more than 3 failed transaction proposals in 1 hour |
| etcdFdExhaustionClose | etcd cluster will run out of file descriptors in 4 hours or less |
| etcdHighNumberOfFailedGRPCRequests | Value of failed gRPC requiest in etcd cluster is high |
| ElasticsearchHeapUsageTooHigh | The Elasticsearch heap usage is over 95% in 5 min |
| ElasticsearchHeapUsageWarning | The Elasticsearch heap usage is over 85% in 5 min |
| ElasticsearchDiskOutOfSpace | The Elasticsearch disk usage is over 85% |
| ElasticsearchDiskSpaceLow | The Elasticsearch disk usage is over 80% in 2 min |
| ElasticsearchClusterRed | The Elasticsearch Cluster is in Red status in 5 min |
| ElasticsearchClusterYellow | The Elasticsearch Cluster is in Yellow status for 6 hours |
| ElasticsearchRelocatingShards | The Elasticsearch has been relocating shards |
| ElasticsearchRelocatingShardsTooLong | The Elasticsearch has been relocating shards for 12 hours |
| ElasticsearchInitializingShards | The Elasticsearch is initializing shards |
| ElasticsearchInitializingShardsTooLong | The Elasticsearch has been initializing shards for 4 hours |
| ElasticsearchUnassignedShards | The Elasticsearch has unassigned shards |
| ElasticsearchPendingTasks | The Elasticsearch has pending tasks. Cluster works slowly |
| ElasticsearchNoNewDocuments | No new documents in Elasticsearch for 15 min |
| ElasticsearchCountOfJVMGCRuns | The Elasticsearch node has JVM GC runs > 10 per sec |
| ElasticsearchGCRunTime | The Elasticsearch node has GC run time in seconds > 0.5 sec. |
| ElasticsearchJsonParseFailures | The Elasticsearch node has json parse failures |
| ElasticsearchBreakersTripped | The Elasticsearch node breakers tripped > 0 |
| ElasticsearchClusterHealthDown | The ElasticSearch cluster health is degrading |
| FluentbitProblem | Fluent Bit pod in Kublr cluster has not processed any bytes for at least 15 minutes |
| FluentdProblem | Fluentd pod in Kublr cluster has not processed any records for at least 15 minutes |
| instanceDiskSpaceWarning | Device on instance in cluster has little space left for over 10 min |
| instanceDiskSpaceCritical | Device on instance in cluster has little space left for over 10 min |
| instanceDiskInodesWarning | Device on instance in cluster has few inodes left for over 10 min |
| instanceDiskInodesCritical | Device on instance in cluster has few inodes left for over 10 min |
| instanceDown | Instance is down for over 1 min in cluster |
| instanceMemoryUsageWarning | Memory usage on instance in cluster is higher than 85% for 5 min |
| instanceMemoryUsageCritical | Memory usage on instance in cluster is higher than 95% for 5 min |
| instanceCpuUsageWarning | CPU usage on instance in cluster is higher than 80% for 8 min |
| instanceCpuUsageCritical | CPU usage on instance in cluster is higher than 95% for 8 min |
| k8sApiServerDown | Kubernetes API server is down for over 1 min in cluster |
| KubeApiServerAbsent | No kube-apiservers are available in cluster for 1 min |
| kubeletDockerOperationErrors | Docker operation error rate is heightened on instance over last 10 min |
| KubeMetricServerFailure | Kube-metric-server is unavailable in cluster for 1 min |
| kublrStatusNotReady | Node condition is on for 5 min in cluster. Status is status |
| LogMoverProblem | Logs mover for cluster stopped sending message to ELK |
| LogstashProblem | No logs filtered for last 10 minutes on Logstash. Check centralize logging system! |
| LogstashDeadLetterQueue | Logstash failed to pass messages to Elasticsearch. If there are lot of messages, *.log files will be removed in 10 minutes |
| nodeStatusCondition | Node condition is not ready on for 7 min in cluster |
| nodeStatusNotReady | Node status is not ready for 7 min in cluster |
| PersistentVolumeUsageForecast | Based on recent sampling, the persistent volume claimed by PVC in namespace is expected to fill up within four days in cluster space |
| PersistentVolumeUsageWarning | The persistent volume claimed by PVC in namespace has value used in cluster space |
| PersistentVolumeUsageCritical | The persistent volume claimed by PVC in namespace has value used in cluster space |
| podPhaseIncorrect | Pod is stuck in a wrong phase for 7 min in cluster |
| podStatusNotReady | Pod is not ready (condition is condition) for 7 min in cluster space |
| podStatusNotScheduled | Pod is not scheduled (condition is condition) for 7 min in cluster space |
| podContainerWaiting | Pod container is waiting for 7 min in cluster space |
| podContainerRestarting | Pod container is restarting for 7 min in cluster space |
| podPhaseEvictedCount | Pods with evicted status detected for 5 min in cluster space |
| promRuleEvalFailures | Prometheus failed to evaluate rule in cluster space |
| replicaSetReplicaNumberLow | Number of replicas is low in cluster for ReplicaSet for 7 min |
| replicaSetFullyLabeledNumberLow | Number of fully labeled replicas is low in cluster for ReplicaSet for 7 min |
| replicaSetReadyNumberLow | Number of ready replicas is low in cluster for ReplicaSet for 7 min |
| replicationControllerReplicaNumberLow | Number of replicas is low in cluster for ReplicationController for 7 min |
| replicationControllerFullyLabeledNumberLow | Number of fully labeled replicas is low in cluster for ReplicationController for 7 min |
| replicationControllerReadyNumberLow | Number of ready replicas is low in cluster for ReplicationController for 7 min |
| replicationControllerAvailableNumberLow | Number of available replicas is low in cluster for ReplicationController for 7 min |
| RabbitmqDown | RabbitMQ node down in cluster |
| RabbitmqTooManyMessagesInQueue | RabbitMQ Queue is filling up (> 500000 msgs) in cluster |
| RabbitmqNoConsumer | RabbitMQ Queue has no consumer in cluster |
| RabbitmqNodeDown | Less than 1 node is running in RabbitMQ cluster |
| RabbitmqNodeNotDistributed | RabbitMQ distribution link state is not ‘up’ in cluster |
| RabbitmqInstancesDifferentVersions | Running different version of Rabbitmq in the same cluster , can lead to failure. |
| RabbitmqMemoryHigh | RabbitMQ node use more than 90% of allocated RAM in cluster |
| RabbitmqFileDescriptorsUsage | RabbitMQ node use more than 90% of file descriptors in cluster |
| RabbitmqTooManyUnackMessages | RabbitMQ has too many unacknowledged messages in cluster |
| RabbitmqTooManyConnections | RabbitMQ: the total connections of a node is too high in cluster |
| RabbitmqNoQueueConsumer | RabbitMQ queue has less than 1 consumer in cluster |
| RabbitmqUnroutableMessages | RabbitMQ queue has unroutable messages in cluster |
| SSLCertExpiredWarning | SSL certificate for host in cluster will expire in less than 7 days |
| SSLCertExpiredCritical | SSL certificate for host in cluster has expired |
| statefulSetReadyNumberLow | Number of ready replicas per StatefulSet is low in cluster for StatefulSet for 7 min |
| TargetDown | Prometheus targets down: Value of the job in cluster targets are down |
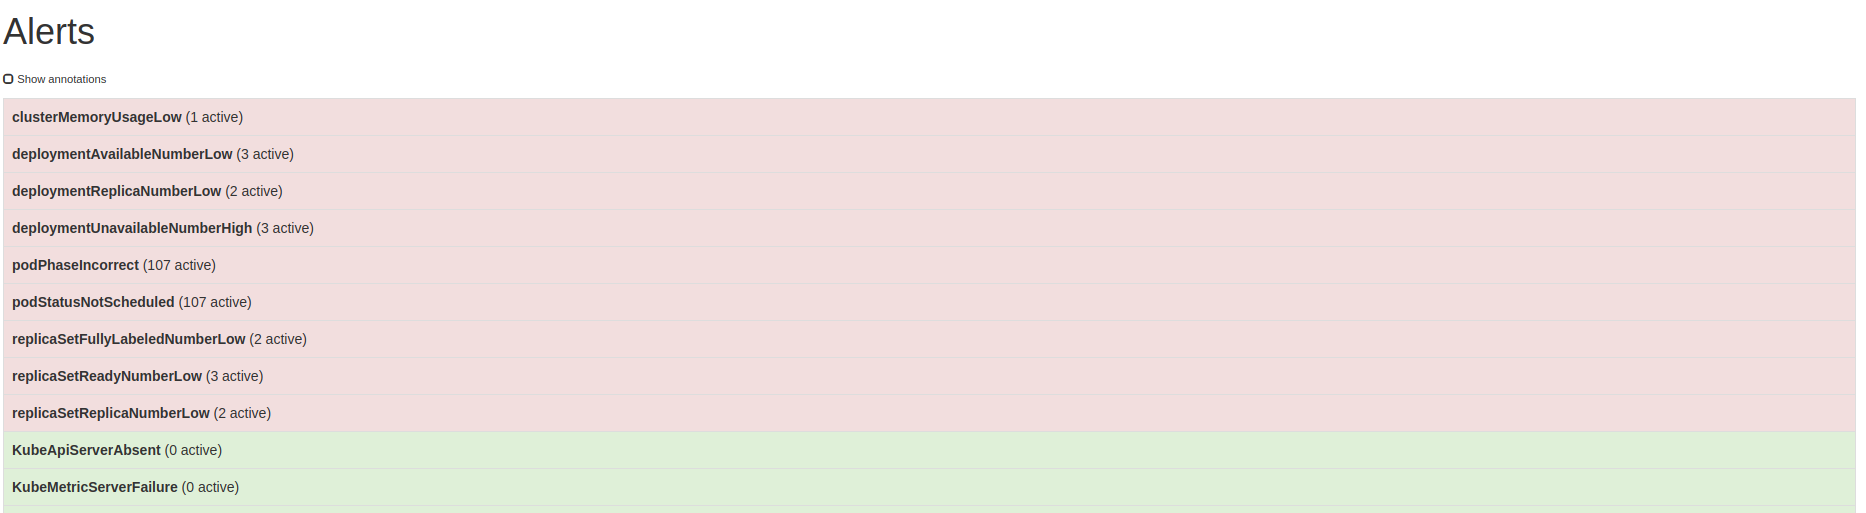
Fired alerts may be found in Prometheus | Alerts menu
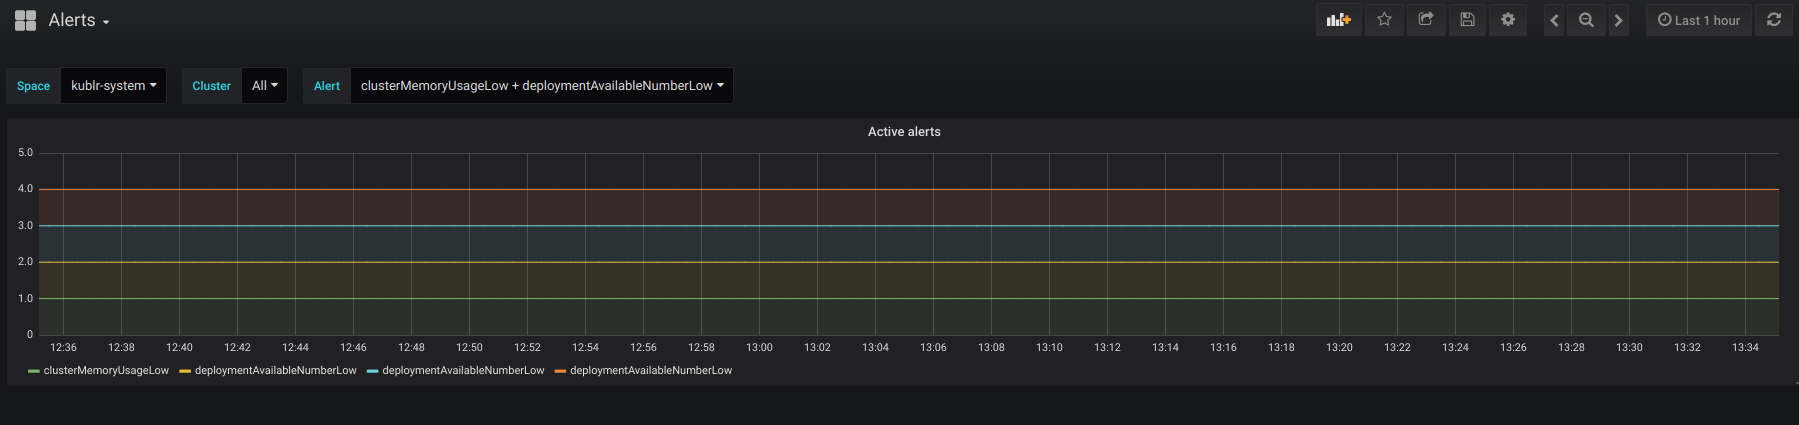
or in Grafana | Alerts dashoard.
In order to send alert notifications to slack channel:
alertmanager:
  config:
    default_receiver: slack
    receivers: |
      - name: slack
        slack_configs:
          - api_url: '<slack_api_url>'
            channel: '<channel_name>'
or deploy kublr platform by adding the above code to spec.features.monitoring.values section of cluster specification:
spec:
  features:
    monitoring:
      enabled: true
        platform:
          enabled: true
        grafana:
          enabled: true
          persistent: true
          size: 128G
        prometheus:
          persistent: true
          size: 128G
        alertmanager:
          enabled: true
      values:
        alertmanager:
          config:
            default_receiver: slack
            receivers: |
              - name: slack
                slack_configs:
                  - api_url: '<slack_api_url>'
                    channel: '<channel_name>'
Please follow the Alertmanager receiver configuration documentation for more information.
