Kublr’s monitoring capability is built on top of Prometheus and Grafana. In that scheme, you can replace Prometheus with the cluster version of VictoriaMetrics.
IMPORTANT NOTICE: Using VictoriaMetrics instead of Prometheus is a technical preview feature and is not recommended in production environments.
VictoriaMetrics can be implemented only within the Kublr platform.
Downstate of one of the availability zones for the VictoriaMetrics does not stop the monitoring function.
Therefore, for the large clusters, when Prometheus performs monitoring and it is restarting, this restart may take a long time, and monitoring will not be performed within this time. But stopped monitoring will never be the case when working with VictoriaMetrics.
NOTE: Prometheus dealing with millions of unique time series (aka high cardinality) or high metrics churn rate has higher chances to crash/restart and much longer restart time.
VictoriaMetrics uses up to 7x less RAM than Prometheus when dealing with high cardinality or metrics churn rate.
Conclusion:
To enable VictoriaMetrics for your Kublr platform, in the specification, set:
spec:
  features:
    monitoring:
      ...
      values:
        victoriametrics:
          enabled: true
        vmcluster:
          clusterDomainSuffix: cluster.local
          vmstorage:
            persistentVolume:
              size: 128Gi
Where clusterDomainSuffix should correlate with:
  network:
    dnsDomain: cluster.local
NOTE: Clusters connected to the control plane of your platform should have the same
clusterDomainSuffix.
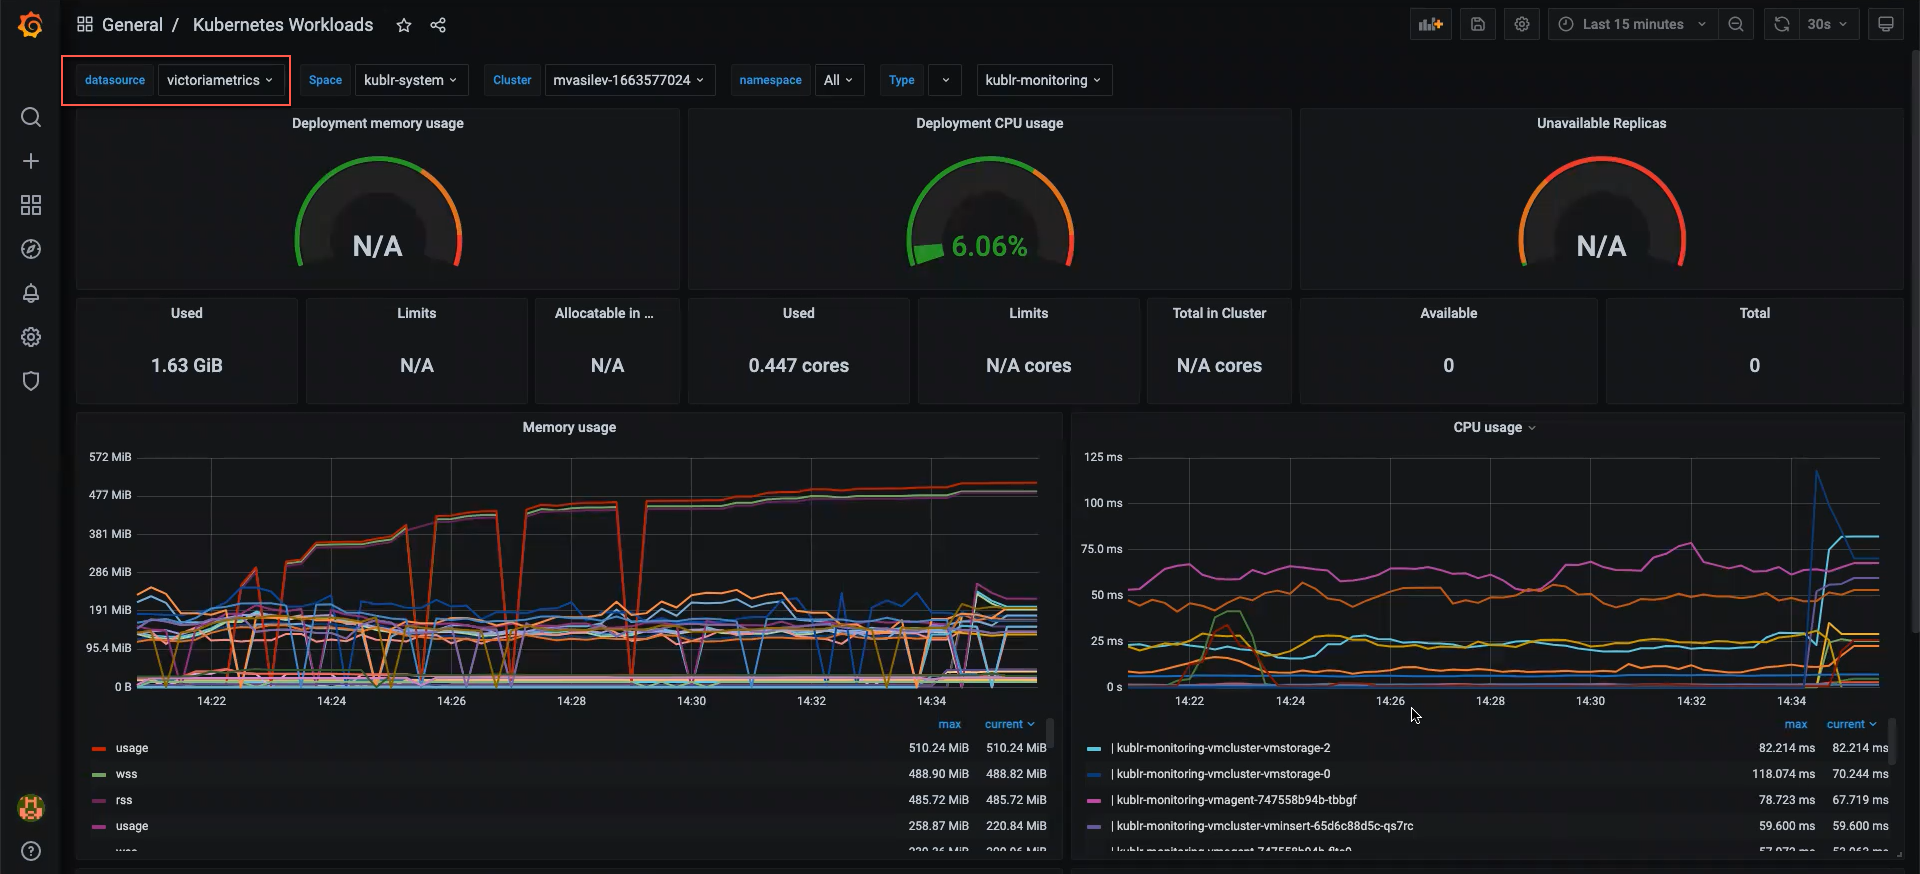
This installs VictoriaMetrics cluster Helm chart for your Kublr platform.
VictoriaMetrics will be automatically set as a default data source for Grafana.
NOTE: While working with VictoriaMetrics is a technical preview feature, you should not disable Prometheus when using VictoriaMetrics.
With Kublr, a cluster version of VictoriaMetrics is deployed. VictoriaMetrics is implemented as a sub-chart of the monitoring chart. It includes the following components:
Pods with the listed components after installing VictoriaMetrics cluster:
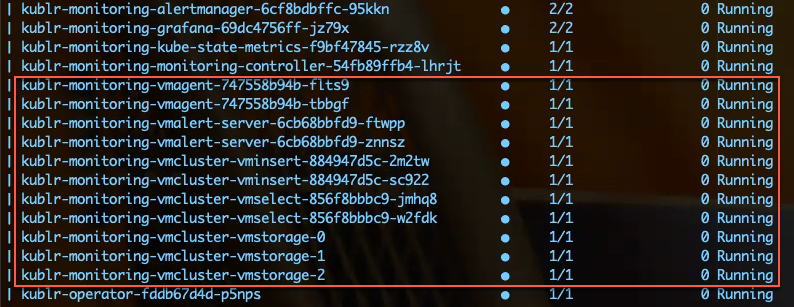
For more information on the components configuration, refer to the values.yaml file of the corresponding VictoriaMetrics Helm charts.
Currently, VictoriaMetrics is implemented with Kublr without its own UI.
