This document covers the main aspects of the Kublr Monitoring feature.
The Kublr Centralized Monitoring feature is built on top of Prometheus and Grafana. Each Kublr Platform-managed Cluster is registered as metrics source in Prometheus. Kubernetes provides cloud, hardware, OS, kubernetes, and applications metrics using Kubernetes API from each cluster respectively. Kublr manages a list of the metrics sources in the Prometheus. Grafana is integrated with the Kublr Control Plane with a single-sign on interface. A centralized monitoring component is deployed to the Kublr Platform as the helm package.
To create a new platform with the Kublr centralized monitoring:
Access your Kublr Demo/Installer instance.
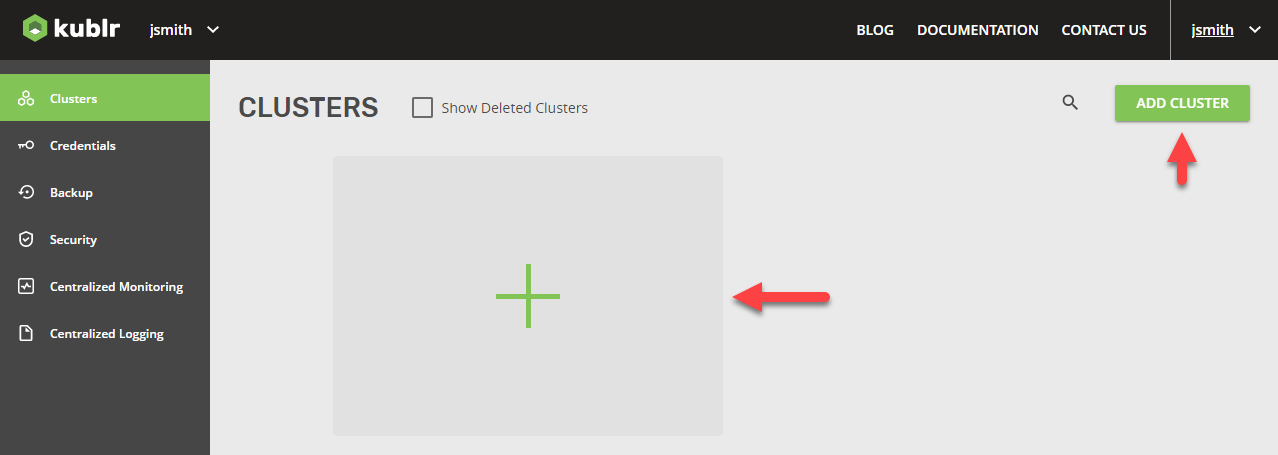
On the left menu, click Clusters.
Click Add Cluster.
 The Select Installation Type dialog is displayed.
In the Select Installation Type dialog, select Platform.
NOTE Centralized Monitoring is always enabled when creating a platform.
Click Continue Setup.
Select your provider.
Fill the necessary parameters (e.g. Full Kublr Platform Credentials).
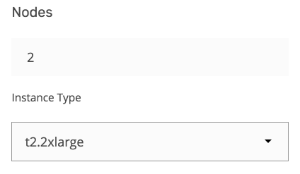
Select Instance Type for Nodes more than default, for example t2.2xlarge for AWS or Standard_A8_v2 for Azure.
Once the platform is created, log in with Full Kublr Platform Credentials and go to the Centralized Monitoring tab.
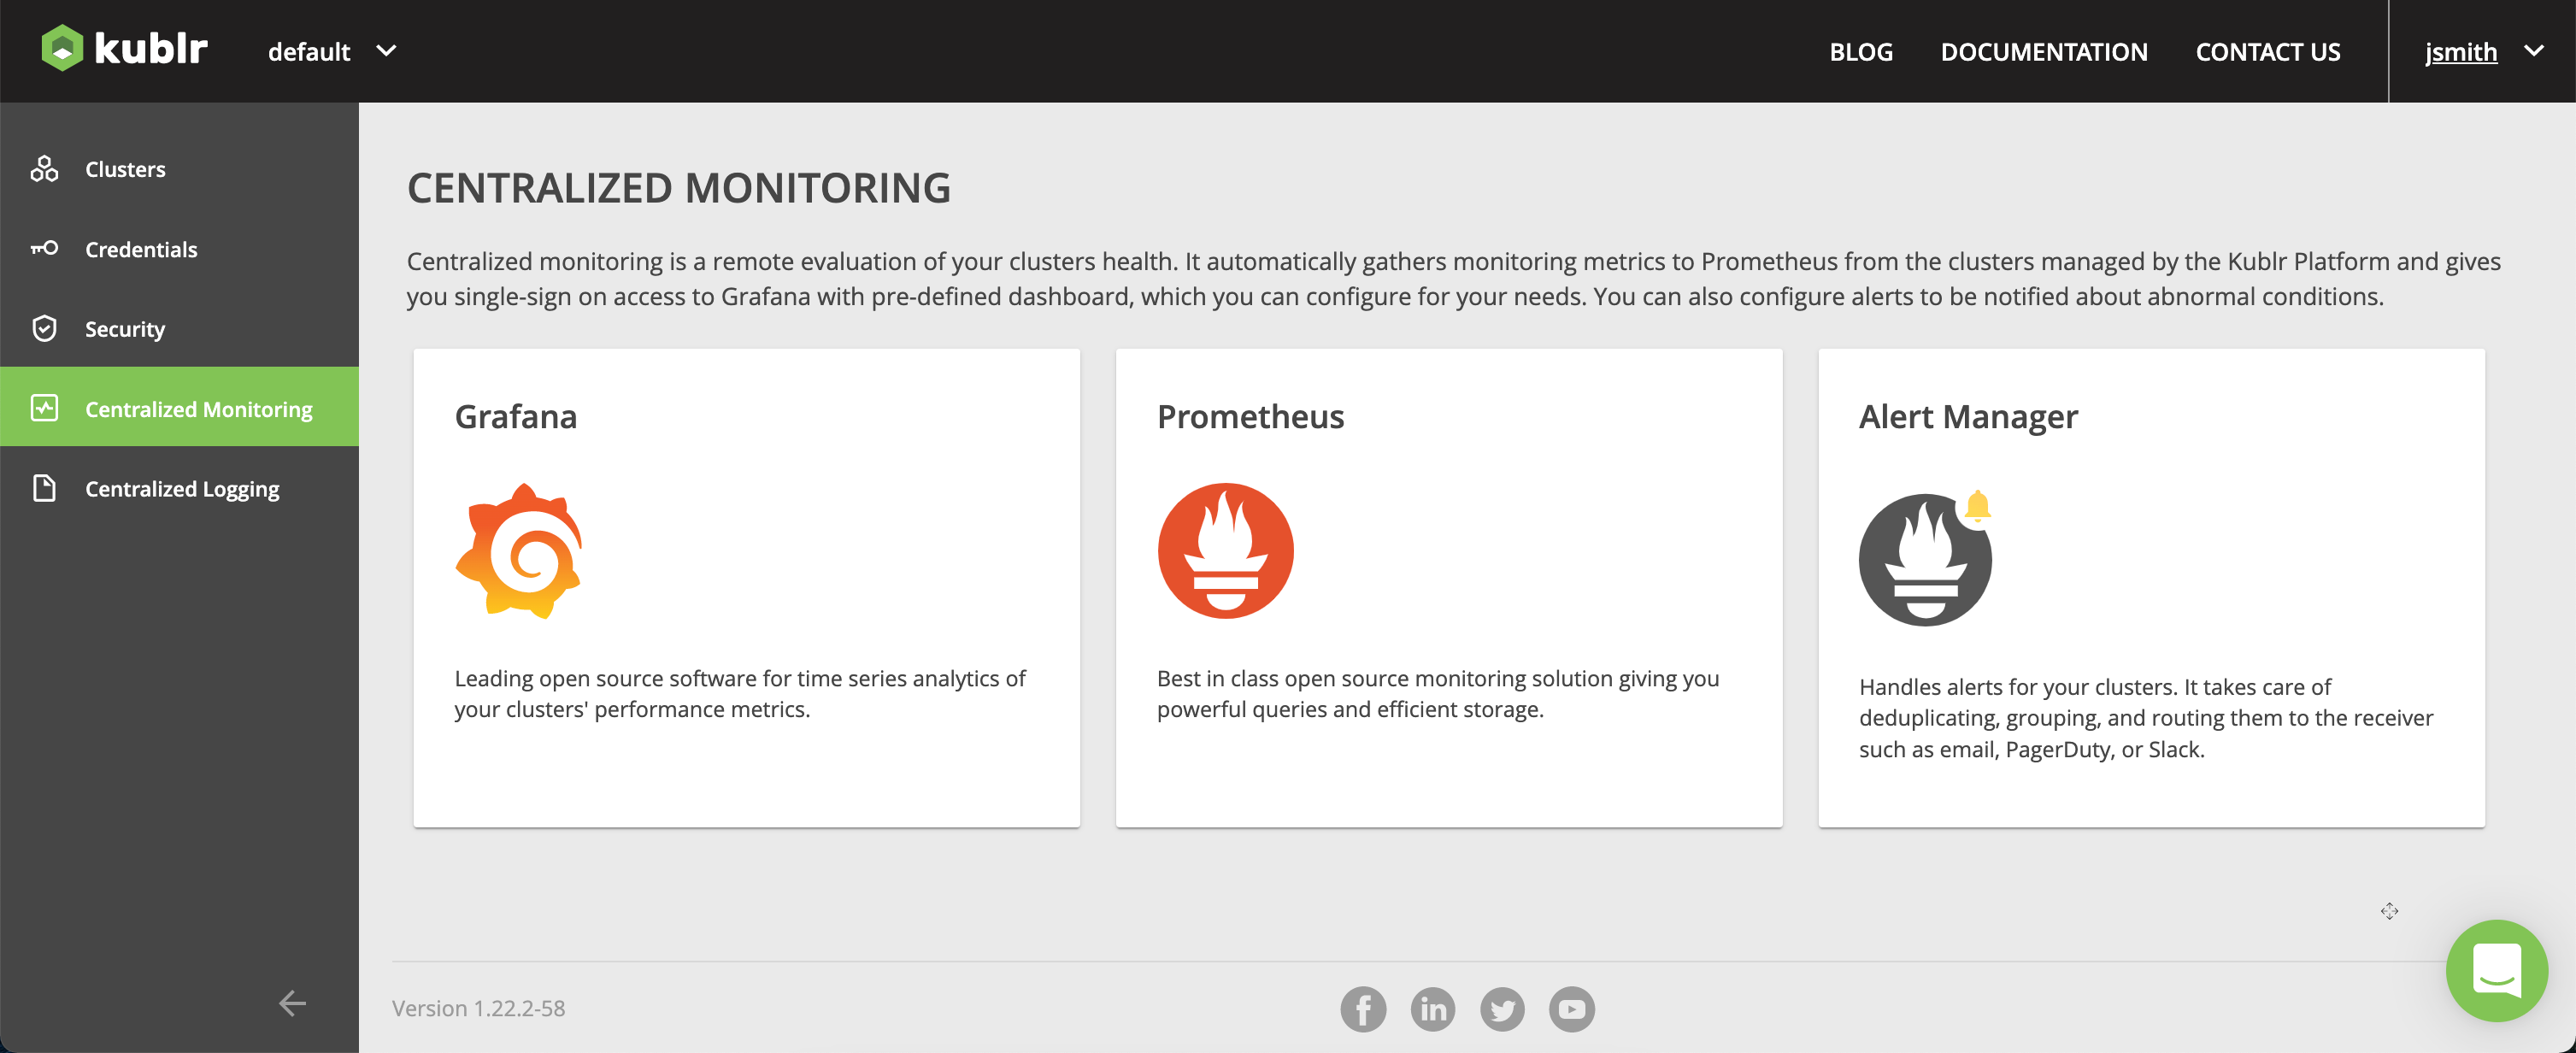
Now you can open Grafana, Prometheus or Alert Manager. Please, refer to the Kublr General Architecture Overview for more details about Centralized Monitoring architecture.
In some cases, self-hosted (per cluster) monitoring is required. To do that:
Access your Kublr platform.
On the left menu, click Clusters.
Click Add Cluster. The add cluster dialog is displayed.
In the add cluster dialog, go to the FEATURES step.
Scroll down and select the Self-Hosted Monitoring option. The Prometheus, Grafana, and Alert Manager components are selected by default. Persistence is enabled for each of them with the default disc sizes for each.
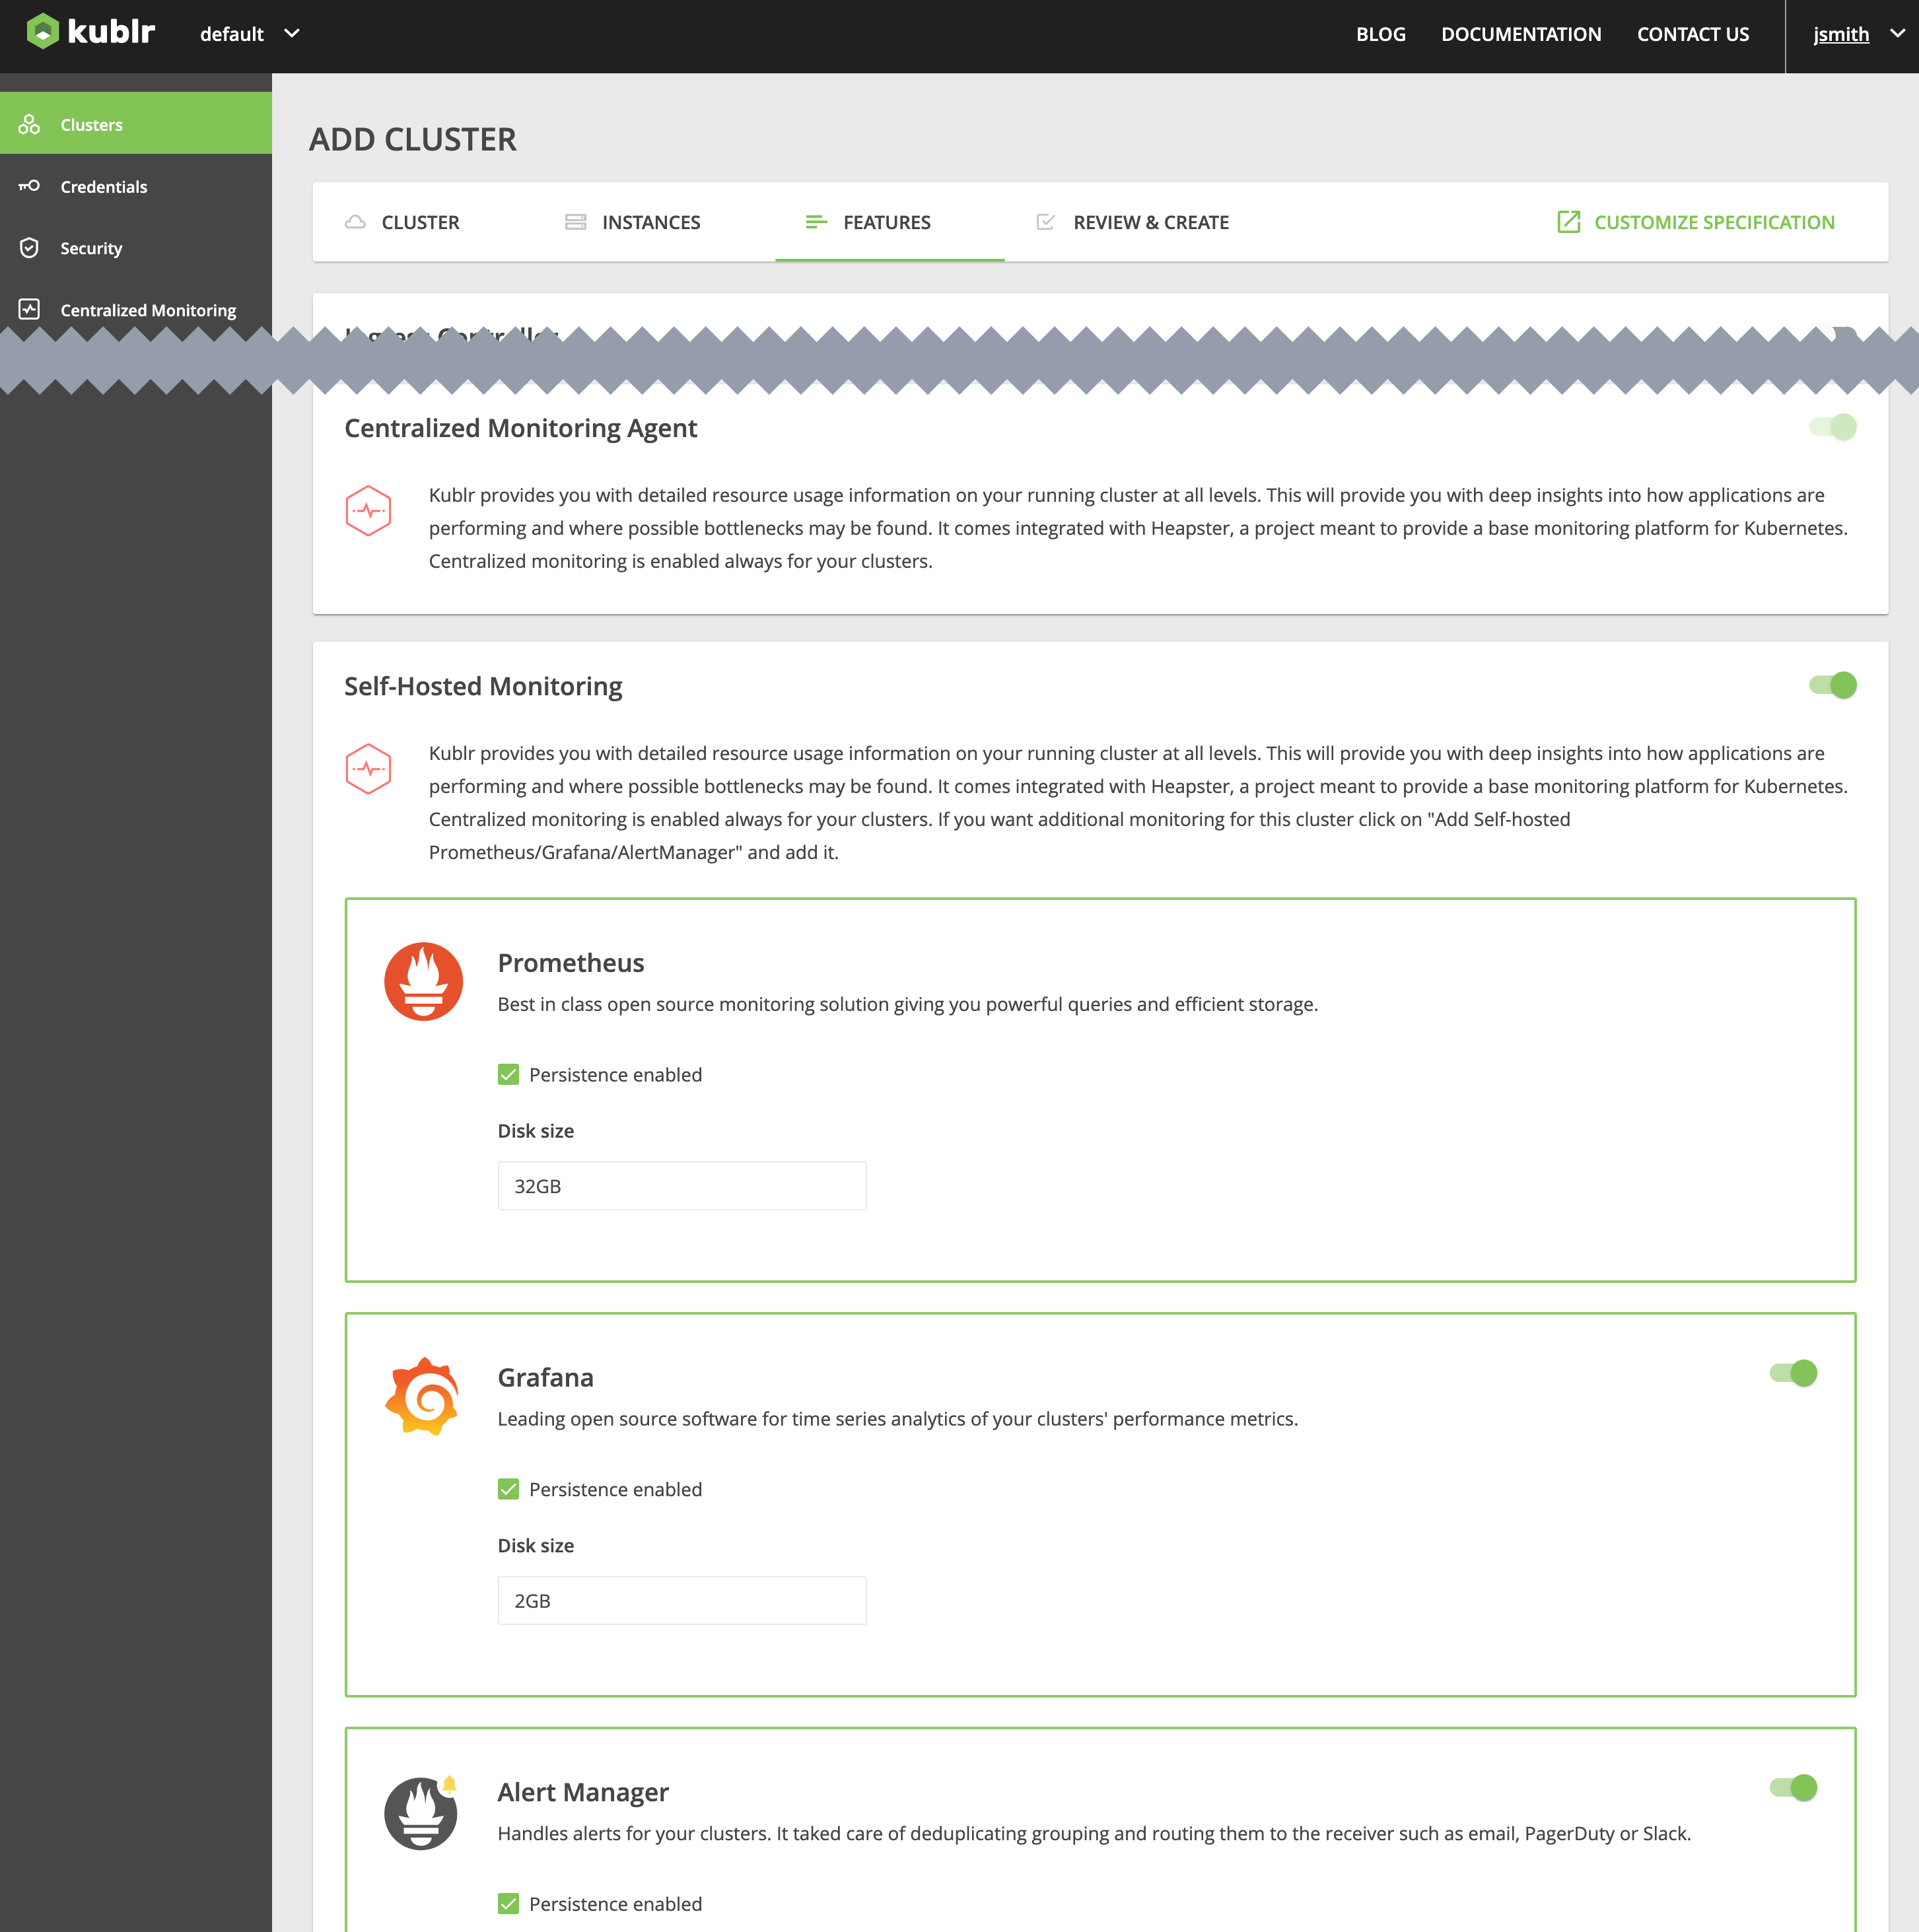
If necessary, change any of the default values to your needs.
Specify other cluster parameters and create it.
For the clusters with self-hosted monitoring, you can use links on the Cluster Overview page to log into Grafana, Prometheus and Alert Manager. By default, Prometheus and Alert Manager do not require authentication, but Grafana requires username and password.
See also at Kublr support portal: Self-hosted logging/monitoring: How to protect with keycloak
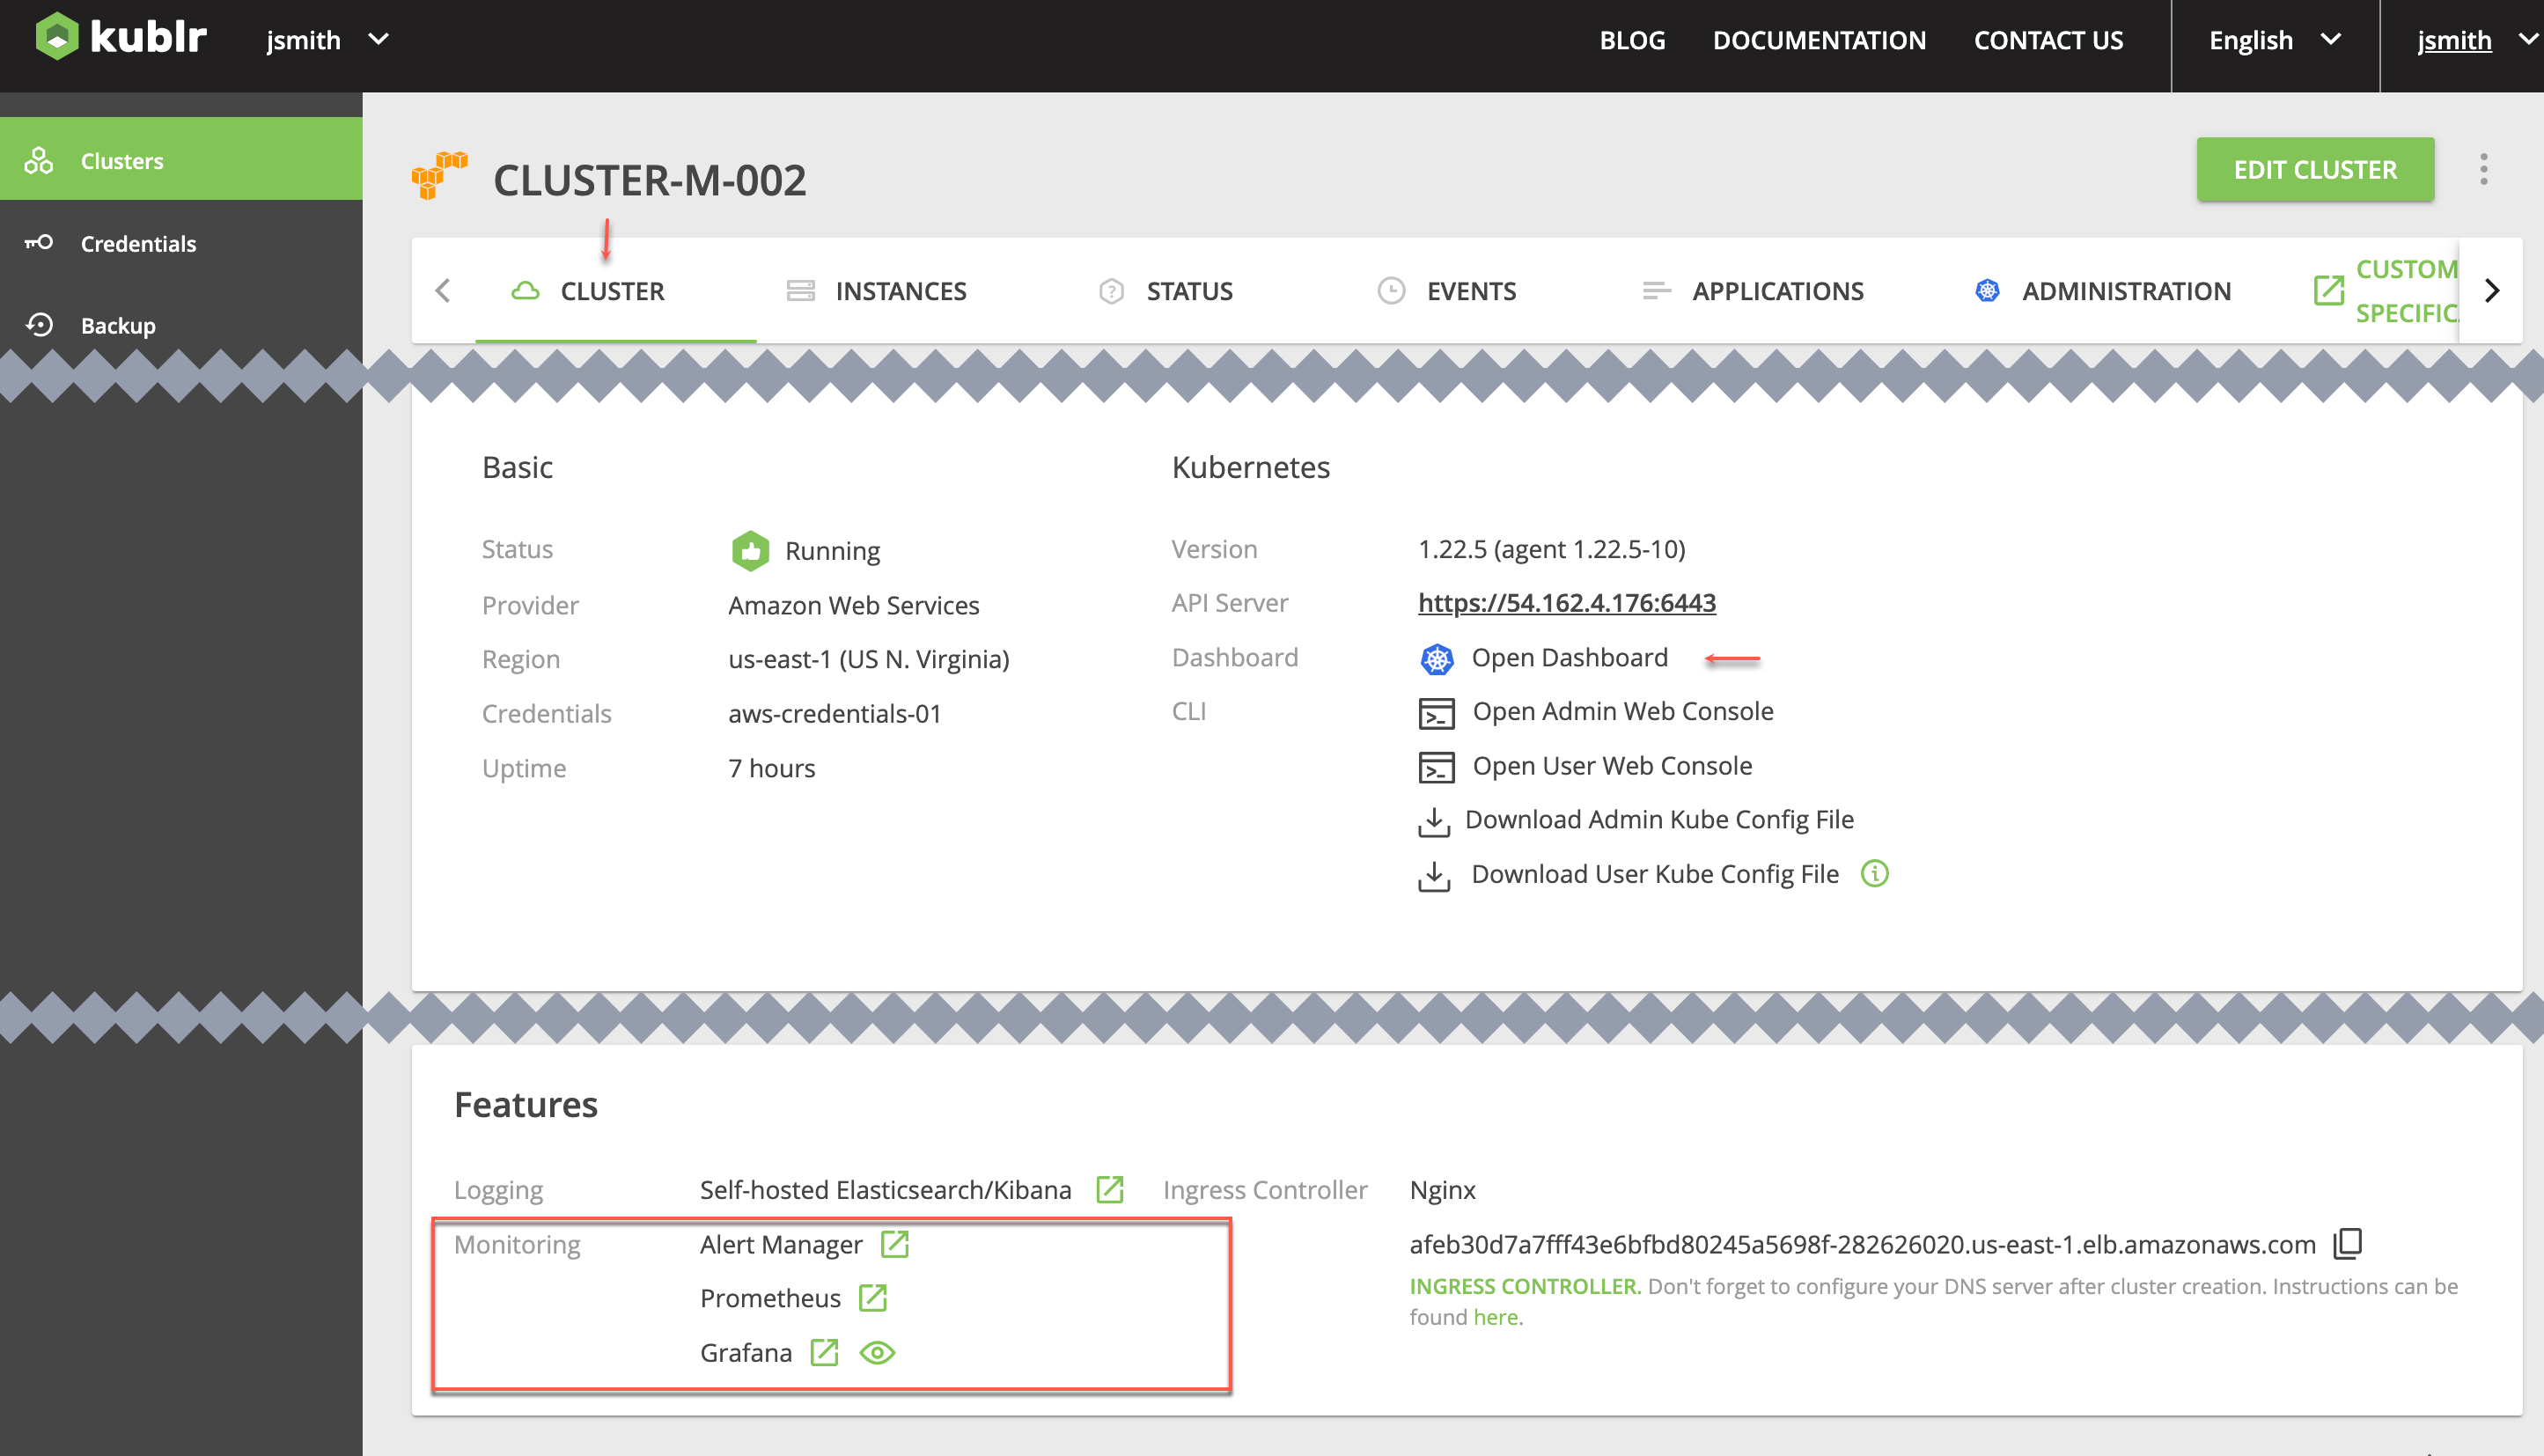
To find Grafana username and password:
Click Open Dashboard.
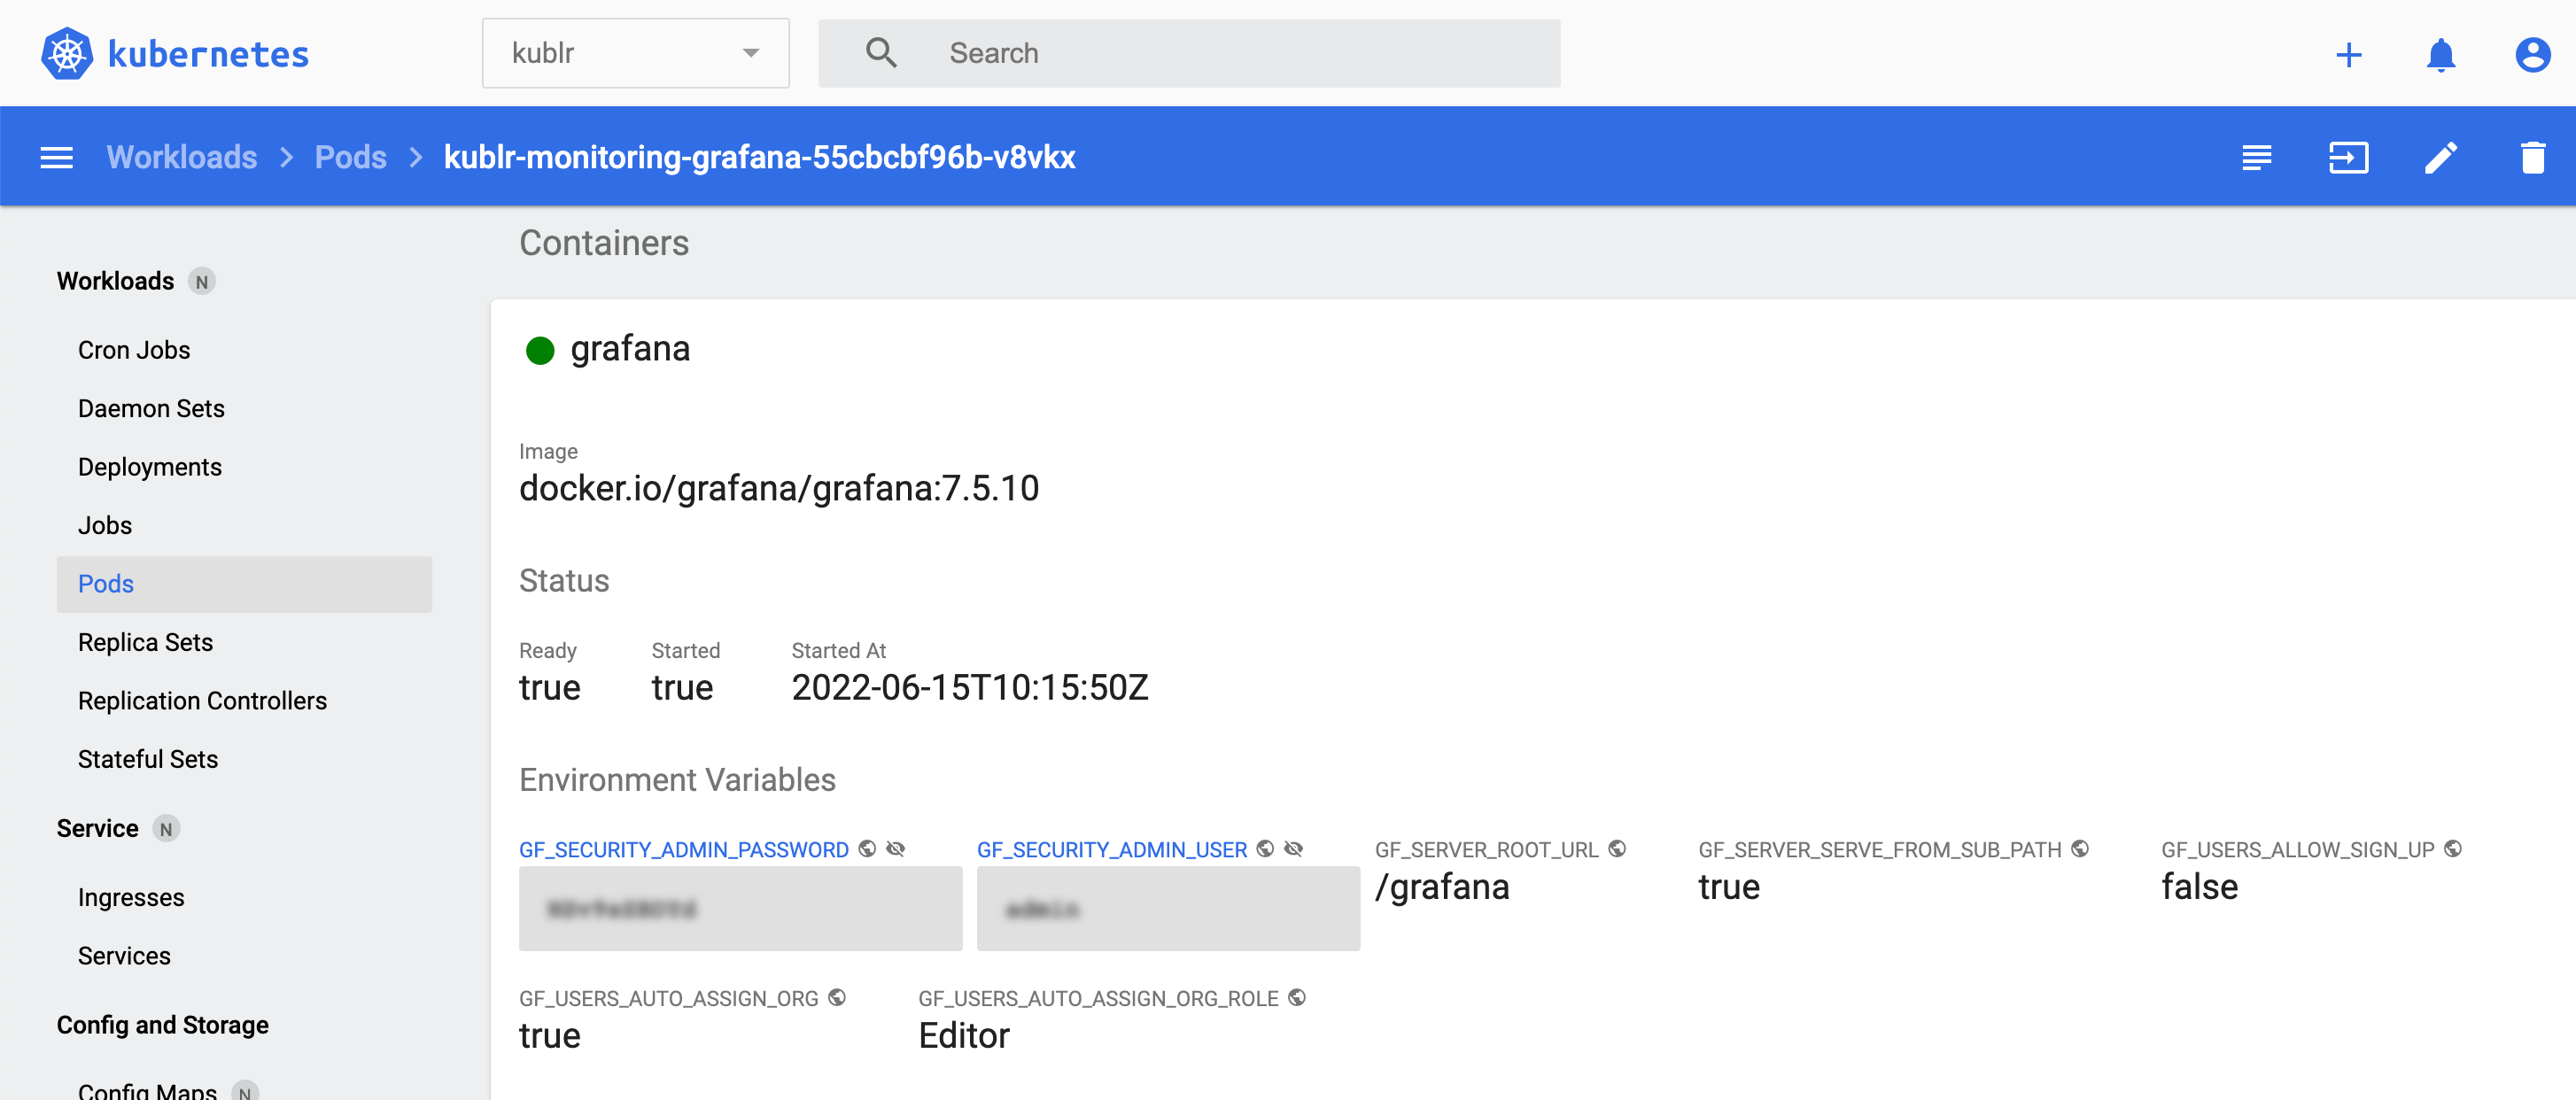
Find Grafana pod (namespace: kublr).
From Environment Variables, copy the user name and the password.
This documentation:
Kublr support portal:
