This document describes how to configure monitoring alerts.
To navigate to Alertmanager UI:
The Alertmanager page is displayed. To view the current Alertmanager configuration, navigate to the Status section, scroll down to Config.
You can transfer values to the Alertmanager configuration via the cluster specification:
kublr-system space).In the specification, use the spec → features → monitoring → values → alertmanager section. Under it, in the config section. Here you can set the alert receivers:
spec:
    ...
    features:
        ...
        monitoring:
            chart:
            version: 1.22.2-14
            enabled: true
            platform: ...
            values:
                alertmanager:
                    alerts: ...
                    config:
                        default_receiver: name-001
                        inhibit rules: 2
                        receivers: |
                          - name: name-001
                            slack_configs:
                                api_url:'https://hooks.slack.com/services/{address}'
                                channel: '#{channelname}'
                                send_resolved: true
                grafana: ...
                kubestatemetrics: ...
                prometheus: ...
Note on the configuration above: default_receiver is not affected by any rules (see the Routes section below).
See information about receivers in the Prometheus Alertmanager documentation.
You can configure any number of receivers of any type. Below is the example:
config:
  default_receiver: stg
  receivers: |
    - name: pagerduty
      pagerduty_configs:
      - routing_key: *************
        send_resolved: false
    - name: stg
      slack_configs:
        - api_url: 'https://hooks.slack.com/services/********'
          channel: '#alerts-stg'
          send_resolved: true
    - name: prod
      slack_configs:
        - api_url: 'https://hooks.slack.com/services/********'
          channel: '#alerts'
          send_resolved: true
    - name: email
      email_configs:
      - to: fake@kublr.com
        from: fake@kublr.com
        smarthost: smtp.gmail.com:587
        auth_username: fake@kublr.com
        auth_identity: fake@kublr.com
        auth_password: "********"
        html: '{{ template "email.google.html" . }}'
Every alert enters the routing tree at the configured top-level route, which must match all alerts (i.e. not have any configured matchers). It then traverses the child nodes. If continue is set to false, it stops after the first matching child. If continue is true on a matching node, the alert will continue matching against subsequent siblings. If an alert does not match any children of a node (no matching child nodes, or none exist), the alert is handled based on the configuration parameters of the current node.
See information about routes in the Prometheus Alertmanager documentation.
Below is the example:
routes: |
    - match:
        kublr_cluster: production
        severity: 'critical'
      continue: true
      receiver: pagerduty
    - match_re:
        alertname: "CMTargetDown|TargetDown"
        kublr_cluster: "kcp-kublr-ovh-local"
      continue: false
      receiver: stg
    - match:
        alertname: "clusterMemoryUsageLow"
      repeat_interval: '168h'
      continue: false
      receiver: qa
    - match_re:
        kublr_cluster: "kcp-kublr-ovh-local|kublr-prod|mirror-0-prod|mirror-1-prod"
      receiver: prod
    - match:
        kublr_cluster: "kublr-build"
      receiver: build
    - match_re:
        kublr_cluster: "kublr-qa|kublr-dev"
      receiver: qa
In the example above:
match elements define the set of labels and their values. If all label values match, the corresponding Prometheus alert is triggered and the alert is sent to the receiver.match but are based on the regular expressions.continue element defines whether the next match elements should be processed if the current one triggered the alert.Kublr provides the default set of predefined alerts. They are stored in Prometheus, at the Alerts section in the format of alert rules.
You can additionally create your own alerts via cluster specification. In the specification, use the spec → features → monitoring → values → alertmanager → alerts section. For example:
monitoring:
...
values:
alertmanager:
alerts:
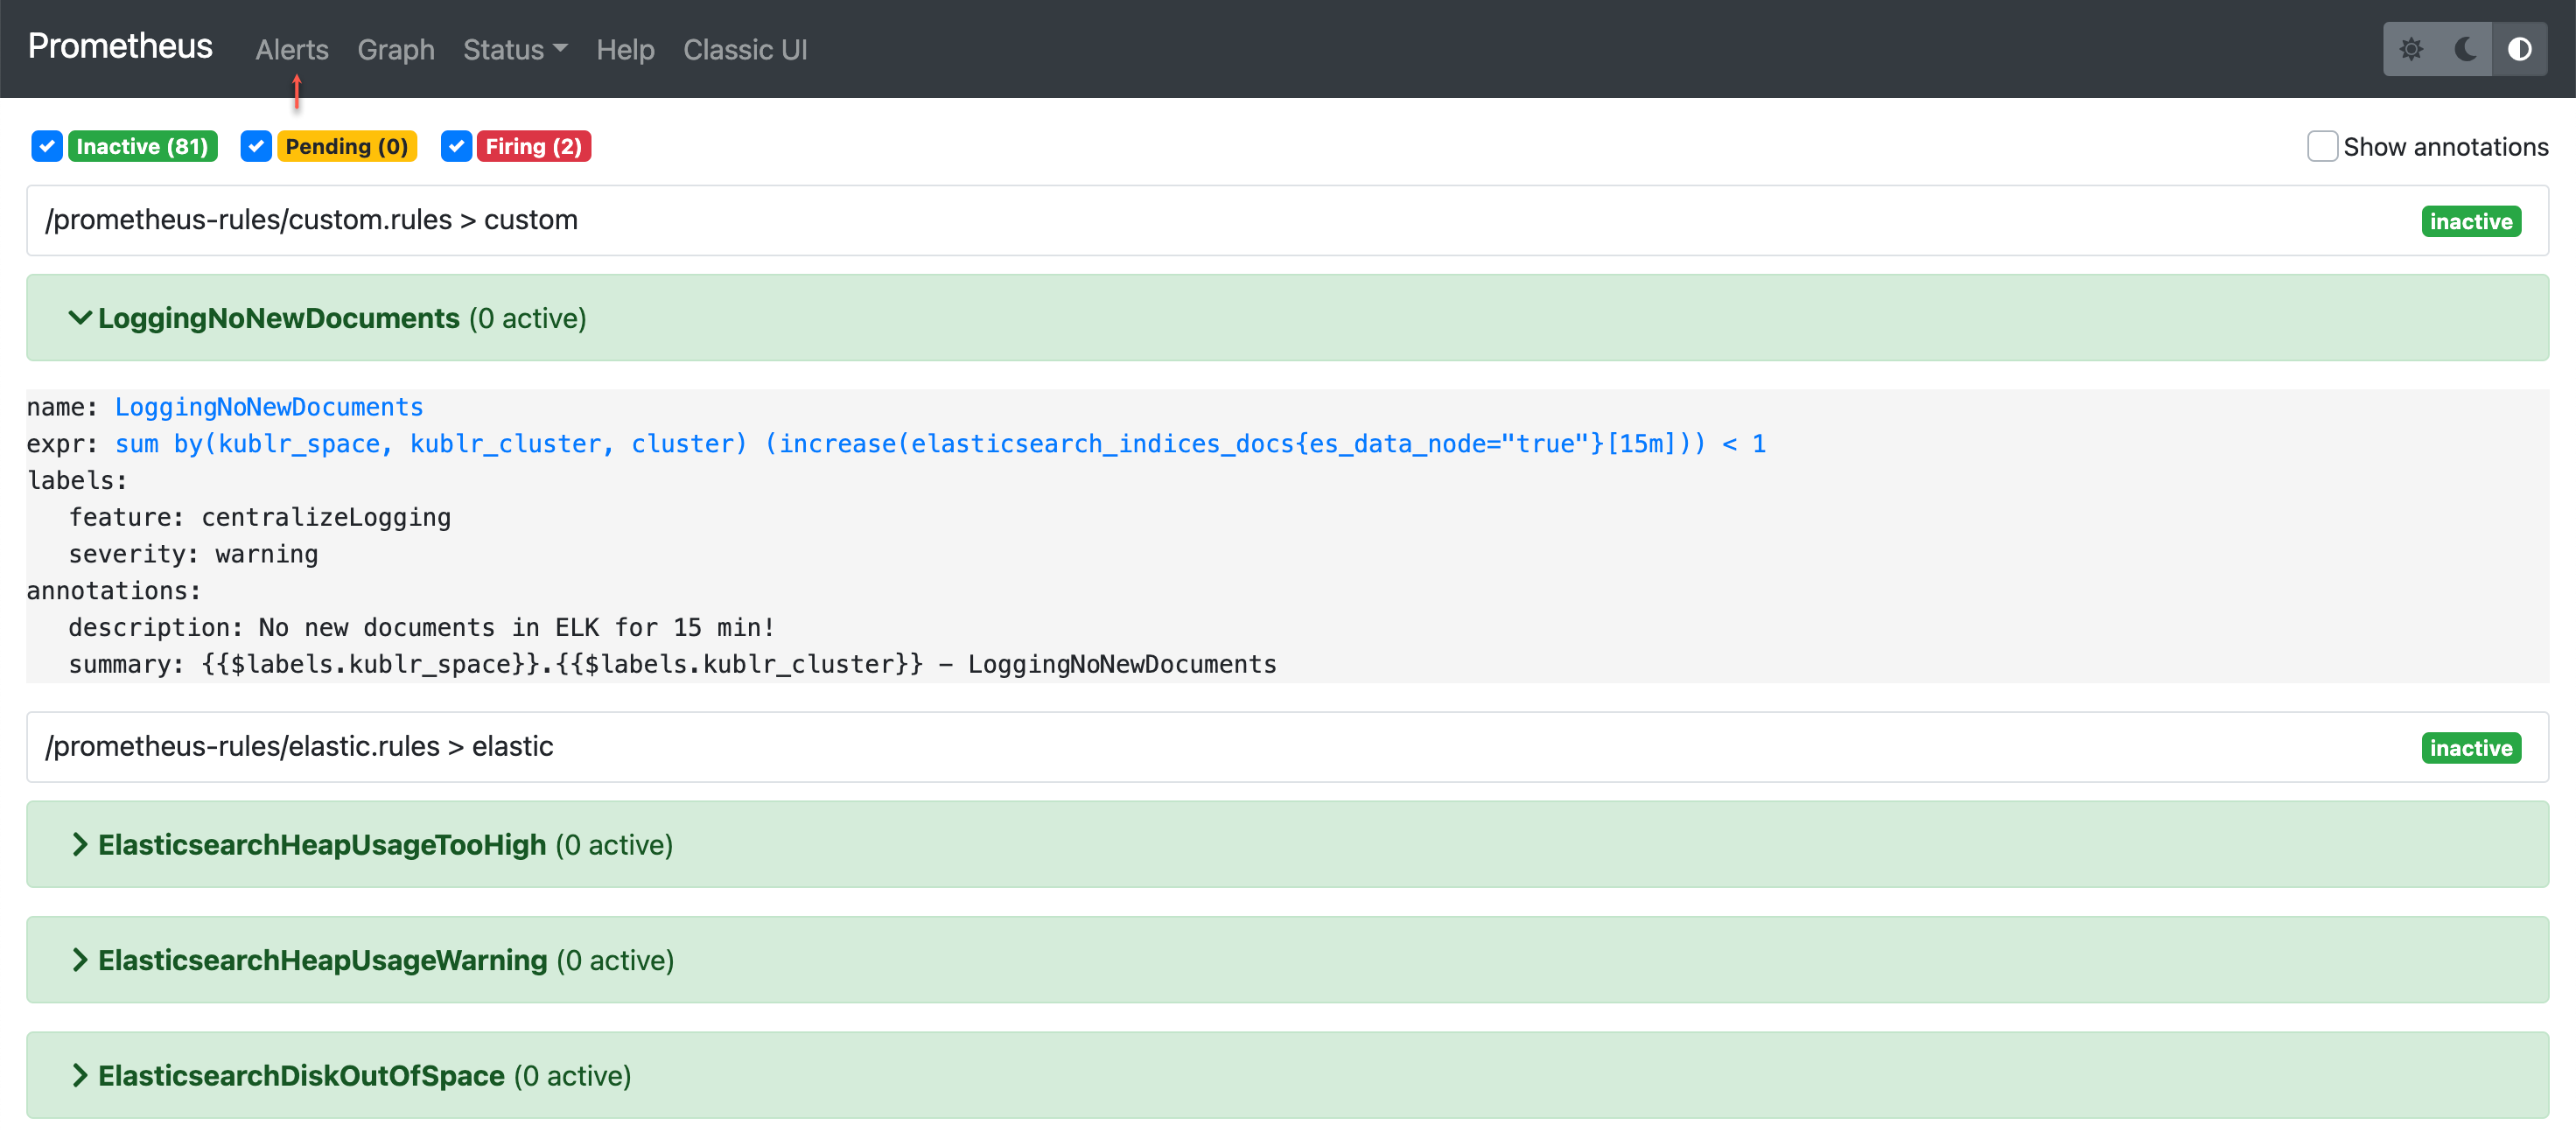
- alert: LoggingNoNewDocuments
annotations:
description: No new documents in ELK for 15 min!
summary: '{{$labels.kublr_space}}.{{$labels.kublr_cluster}} - LoggingNoNewDocuments'
expr: 'sum by (kublr_space, kublr_cluster, cluster) (increase(elasticsearch_indices_docs{es_data_node="true"}[15m])) < 1'
labels:
feature: centralizeLogging
severity: warning
config:
...
The specification above adds the following alert rule to Prometheus:
In the spec → features → monitoring → values → prometheus section of the cluster specification, you can edit different Prometheus parameters.
Below is the example:
monitoring:
      ...
      values:
        ...
        prometheus:
          config:
            retentionPeriod: 5d
            extraRulesConfigmaps:
                - fileMask: '*.yaml'
                  name: prometheus-sloth-rules
          persistence:
            enabled: true
            preconfiguredPersistentVolumeClaim: prometheus
            size: 128Gi
          resources:
            limits:
              memory: 10G
            requests:
              memory: 2G
          rules:
            overrides:
              - _disable: true
                _match:
                  alertRegexp: clusterMemoryUsageLowInfo|clusterMemoryUsageWarning|instanceMemoryUsageWarning
In the configuration above, retentionPeriod defines how long the Prometheus metrics are stored; default value is 7d (7 days). See detailed information about extraRulesConfigmaps in the section below.
The extraRulesConfigmaps section allows customizing Prometheus using Kubernetes config maps.
See how the config map prometheus-sloth-rules from configuration in previous section looks on the Kubernetes dashboard:
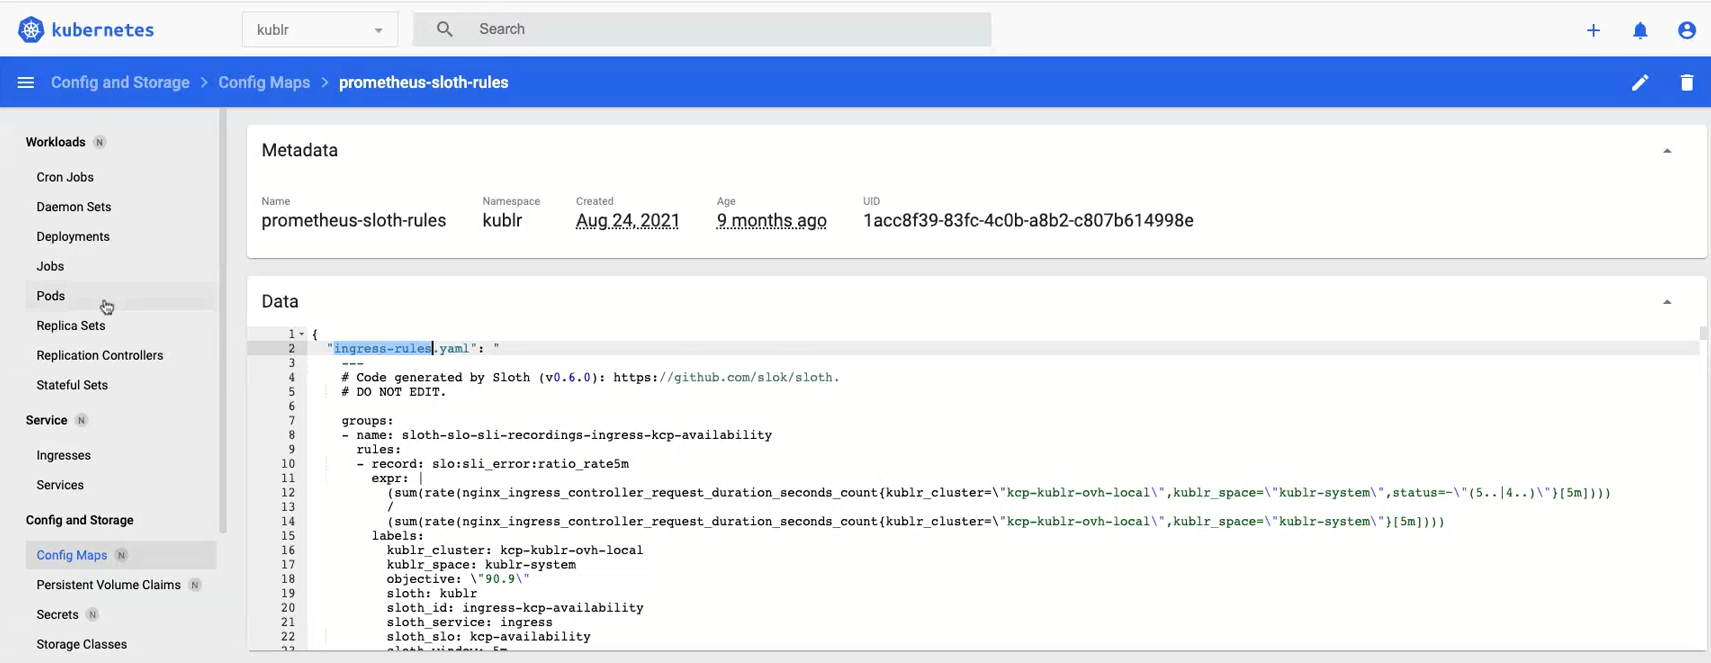
The content of config map is added as a file to the prometheus pod of the cluster. Note that several files can be specified within one config map as well as several config maps may be added via the cluster specification.
The content of a config map is custom and should be prepared by you. Note that it should have format compatible with Prometheus.
See extended example on the Kublr support portal: Monitoring: using slock/sloth for SLOs
Starting from Kublr version 1.22, in the cluster specification, there is the ... → prometheus → rules → overrides section. The section allows overriding of predefined alert rules provided by Kublr.
Below are the examples:
monitoring:
      ...
      values:
        ...
        prometheus:
          ...
          rules:
            overrides:
              - _disable: true
                _match:
                  alertRegexp: clusterMemoryUsageLowInfo|clusterMemoryUsageWarning|instanceMemoryUsageWarning
In the example above, all alerts matching the regular expression (containing 3 names of alert rules) will be disabled.
prometheus:
  rules:
    overrides:

      # disable all default Kublr rules except one
      - _disable: true
        _match:
          alertNot: RabbitmqUnactiveExchange

      # override specific rule using templating (with access to the original rule properties)
      - alert: RabbitmqUnactiveExchange
        for: 35m-{{.Rule.for}}
        hjsfdk: '{{ .Rule }}'
        _template: true
Kublr supports Alert Manager inhibition rules.
The inhibition rules mute the alerts (target) matching a set of matchers when the alerts (source) exist that matche another set of matchers. Both target and source alerts must have the same label values for the label names in the equal list.
To find the default Kublr inhibition rules, access the Alert Manager, then go to the Status tab and in presented Config find the inhibit_rules section.
There are three default inhibition rules:
The one saying that any “critical” severity alert inhibits the non-critical ones (for example, warnings) inside specific Kublr cluster/space if source and target alert belong to the same silence group.
- source_matchers:
  - kublr_cluster=~".+"
  - kublr_space=~".+"
  - severity="critical"
  - silence_group=~".+"
target_matchers:
  - severity!="critical"
equal:
  - silence_group
  - kublr_space
  - kublr_cluster
Note that silence_group is an alert’s label. You can find alerts with specified silence groups in (Centralized) Monitoring → Prometheus → Alerts → filter by entering silence_group in a search field.
The one saying that any “warning” severity alert inhibits the “info” alerts inside specific Kublr cluster/space if source and target alert belong to the same silence group.
- source_matchers:
  - kublr_cluster=~".+"
  - kublr_space=~".+"
  - severity="warning"
  - silence_group=~".+"
  target_matchers:
  - severity="info"
  equal:
  - silence_group
  - kublr_space
  - kublr_cluster
The one saying that any “workload” level alert inhibits the non-critical severity alerts from “replicaset” and “pod” levels inside specific Kublr cluster/space.
- source_matchers:
  - kublr_cluster=~".+"
  - kublr_space=~".+"
  - level="workload"
  target_matchers:
  - level=~"replicaset|pod"
  - severity!="critical"
  equal:
  - kublr_space
  - kublr_cluster
