Kublr centralized log collection subsystem is built on top of:
It is intended to automatically collect logs from from all managed clusters and the Kublr control plane itself, and collect them in the central log management and storage system.
The main components are shown in the diagram:
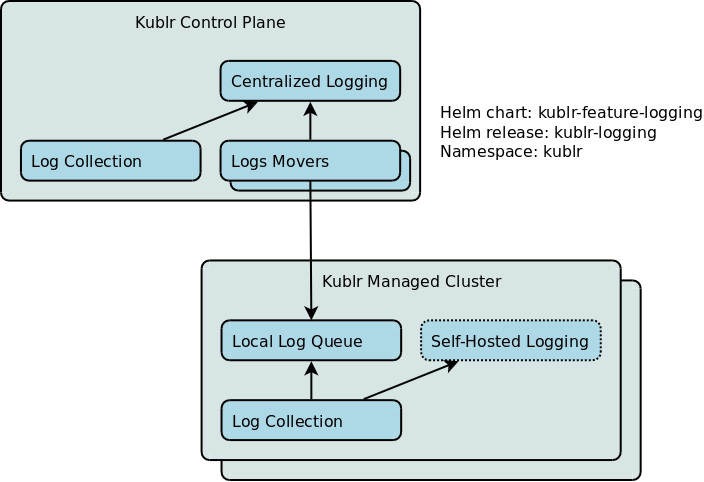
Log Collection is a set of components running on each node of the cluster(s) collecting logs from the various locations on the nodes and sending them to log collectors for further processing.
Log Collection components are present in the managed clusters as well as in the Kublr Control Plane.
Self-Hosted Logging is an ELK (Elastic / Kibana) stack optionally deployed in managed clusters.
Local Log Queue is a temporary log holding queue based on RabbitMQ. The queue is intended to temporarily persist logs in the managed cluster before they are moved to te centralized store.
Logs Movers run in the Kublr Control Plane and move logs from the temporary holding queues in the managed clusters to the centralized log storage.
Centralized Logging is an ELK (Elastic / Logstash / Kibana) stack with some additional components running in the Kublr Control Plane.
Note In addition to the centralized log collection, local ElasticSearch and Kibana may be installed by the user in the managed clusters. They may be used instead or in addition to the centralized log collection mechanism.
The logs collected from multiple managed clusters are stored in Elastic indices using the name convention based on the space and cluster name:
Log index name pattern for clusters is kublr_{space-name}_{cluster-name}_{namespace}_{index-qualifier}.
Default index qualifier is the date in format YYYY.MM.DD.
Therefore indices generated in the centralized log collection Elastic cluster will have names such as
kublr_my-space_my-cluster_my-namespace_2021.05.15.
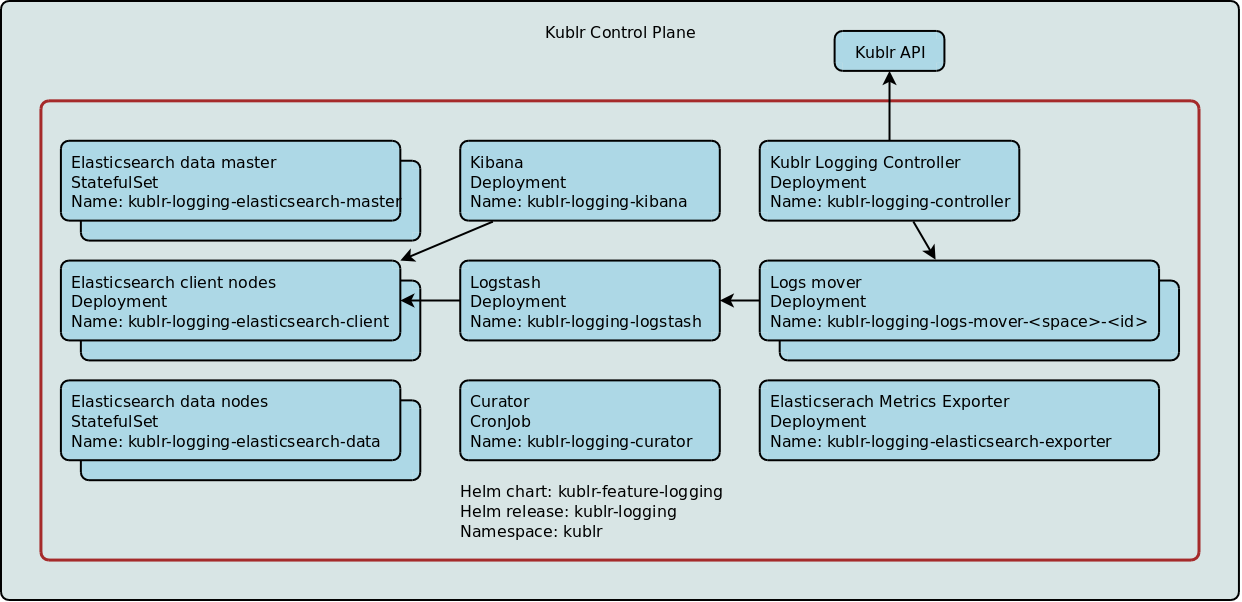
The main components of the centralized log management include:
Elastic cluster - Elastic cluster including (potentially multiple) master nodes, data nodes and client node.
Starting with Kublr 1.20.2 it is also possible to setup multiple groups of ELastic data nodes with different characteristics, which is mostly useful when hot-warm-cold log indices lifecycle is configured.
Search Guard - by default Kublr deploys Elastic with integrated Search Guard plugin. This allows setting up RBAC on indices level.
Kibana - Elastic Kubana instance(s) used to visualize data stored in Elastic.
Curator - curator cron job is configured by Kublr to process indices according to a schedule (e.g. delete on retention expiration)
Kublr Logging Controller - a Kublr components that watches cluster configuration changes in Kublr API, updates Elastic and Search Guard configuration and RBAC rules correspondingly, and starts Logs Mover instances for each cluster.
Logs Movers - processes running in the Kublr Control Plane and moving logs from the temporary holding queues in the managed clusters to the Logstash import queue.
Logstash - Elastic import queue management component processing and incoming logs and other messages and sending them to Elastic.
Elasticsearch Metrics Exporter - exports ELK stack metrics for Prometheus/monitoring collection
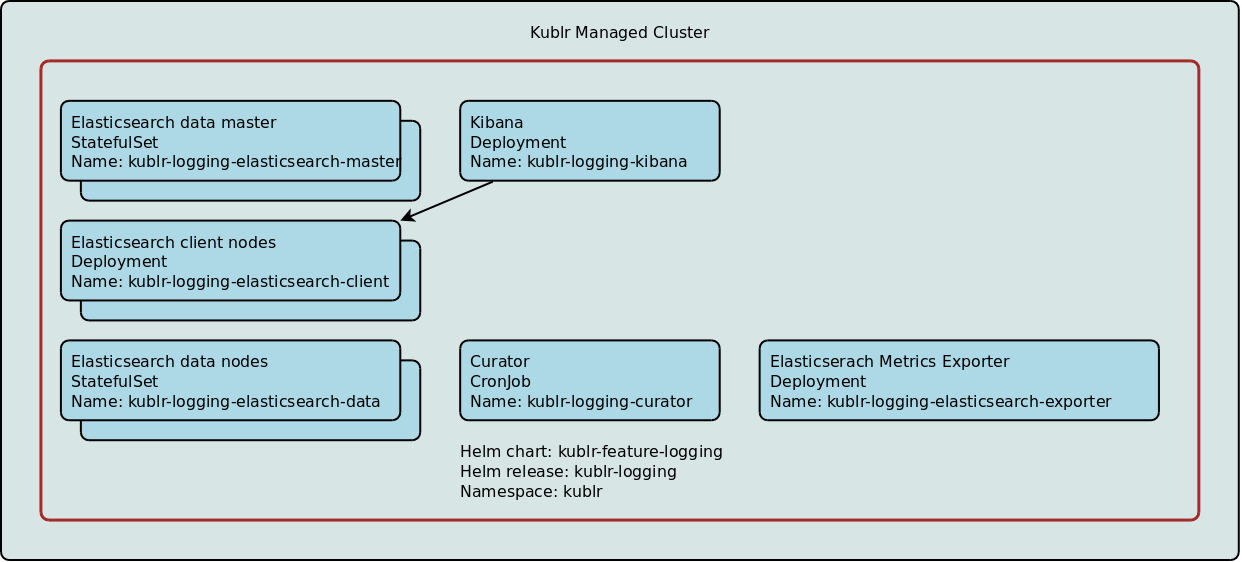
Self-hosted log collection stack can be optionally deployed into any managed cluster.
Architecturally self-hosted log collection stack is very similar to the centralized log collection described above, with a few components discabled:
Elastic cluster - Elastic cluster including (potentially multiple) master nodes, data nodes and client node.
Starting with Kublr 1.20.2 it is also possible to setup multiple groups of ELastic data nodes with different characteristics, which is mostly useful when hot-warm-cold log indices lifecycle is configured.
Search Guard - by default Kublr deploys Elastic with integrated Search Guard plugin. This allows setting up RBAC on indices level.
Kibana - Elastic Kubana instance(s) used to visualize data stored in Elastic. Kibana with single sign-on from Kublr provides convenient UI for accessing and searching log entries from all clusters.
Curator - curator cron job is configured by Kublr to process indices according to a schedule (e.g. delete on retention expiration)
Elasticsearch Metrics Exporter - exports ELK stack metrics for Prometheus/monitoring collection
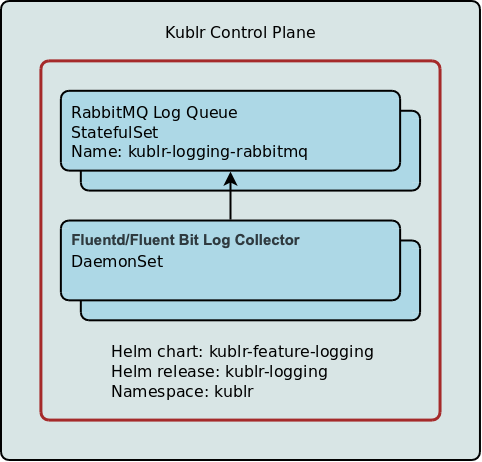
Main components of the managed clusters’ centralized log collection integration include log collector based on Fluentd/Fluent Bit and a local temporary queue based on RabbitMQ. A cluster-level helm package with RabbitMQ and Fluentd/Fluent Bit is deployed in each managed Kubernetes cluster.
Fluentd/Fluent Bit collects log entries from all levels: OS, pods, Kubernetes components, and Kublr agent. The log collector sends collected logs to RabbitMQ by default, but it can additionaly be configured to also send logs to the cloud systems (e.g. AWS CloudWatch) and/or syslog server. Any other additional targets supported by Fluentd/Fluent Bit can also be configured via configuration customization.
The following section include summary overview of additional configuration values that can be provided to Kublr centralized logging feature.
These additional values can be provided via the cluster specification in the corresponding feature section:
spec:
  ...
  features:
    logging:
      ...
      values:
        logstash:
          replicas: 1
          ...
        ...
Below is the default configuration required for the logging feature functioning. If you need to change some values, this should be done carefully.
elasticsearch:
  xpackEnabled: true
  license: ''
  cluster:
    config:
    env:
    envFrom:
    # include as Yaml for using constructs as:
    # name: ELASTIC_PASSWORD
    # valueFrom:
    #   secretKeyRef:
    #     name: elastic-secret
    #     key: password
    extraEnvs:
  retentionPeriodDays: 7
  # Keystore configuration section
  # https://www.elastic.co/guide/en/cloud-on-k8s/master/k8s-es-secure-settings.html
  # kubectl create secret generic elastic-config-secret --from-file=xpack.watcher.encryption_key=./watcher_encryption_key
  # kubectl create secret generic elastic-config-custom-path --from-literal=slack_url='https://hooks.slack.com/services/asdasdasd/asdasdas/asdasd' --from-literal=some_another=test
  # keystore:
  # - secretName: elastic-config-secret
  # - secretName: elastic-config-custom-path
  #   items:
  #   - key: slack_url
  #     path: xpack.notification.slack.account.otheraccount.secure_url
  keystore: []
  # This section allow to deploy hot/warm/cold data nodes.
  # Classic data node should be disabled manually by providing elasticsearch.nodeGroups.data: null
  hotWarmColdArchitecture:
    enabled: false
    initialTier: "data_hot"
    # kublr-policy should be created manually in Elasticsearch
    defaultPolicy: "kublr-policy"

  nodeGroups:
    master:
      replicas: 1
    client:
      replicas: 1
    data:
      replicas: 1
    data-hot:
      rolesOverride: "data_hot,data_content"
      replicas: 1
    data-warm:
      rolesOverride: "data_warm,data_content"
      replicas: 1
    data-cold:
      rolesOverride: "data_cold,data_content"
      replicas: 1

#RabbitMQ used for central logging
rabbitmq:
  # rabbitmqMemoryHighWatermark = k * memory limit, where k range 0.4 to 0.66
  rabbitmqMemoryHighWatermark: 512MiB
  # disk_free_limit.absolute: Disk free space limit of the partition on which RabbitMQ is storing data
  # Example:
  # env:
  #  - name: NODE_NAME
  #    valueFrom:
  #      fieldRef:
  #        fieldPath: spec.nodeName
  rabbitmqDiskFreeLimit: 1024MiB
  clusterDomain: cluster.local

kibana:
  # https://www.elastic.co/guide/en/kibana/7.x/settings.html
  additionalSettings:
  env:
  extraEnvs:

elasticsearchExporter:
  enabled: true

fluentd:
  enabled: true
  additionalVolume:
  additionalConfig:

logstash:
  replicas: 1
  logstashPassword:
  # https://www.elastic.co/guide/en/logstash/current/logstash-settings-file.html
  additionalSettings:
  # https://www.elastic.co/guide/en/logstash/current/configuration-file-structure.html#configuration-file-structure
  additionalConfig:

# cloudwatch sink parameters
cloudwatch:
  enabled: false
  region:
  logGroupName:

# syslog sink parameters
syslog:
  enabled: false
  host:
  port: 514
  severity: notice
  tag: kubernetes

# elasticsearch curator parameters
curator:
  enabled: true
  schedule: "0 1 * * *" # run nightly at 1:00, crontab format
Note When
rabbitmqMemoryHighWatermarkexceeds 768MiB, please contact Kublr support team.
Below is the default configuration for the deploy of the nodes. In this example, which data nodes will be applied depends on other parameters. For example, by default, only data will work, and data* will not, because the hot-warm-cold mode is not enabled.
elasticsearch:
  nodeGroups:
    master:
      antiAffinity: "soft"
      nodeSelector: {}
      tolerations: {}
      readinessProbe:
        tcpSocket:
          port: 9200
        initialDelaySeconds: 10
        periodSeconds: 30
    client:
      antiAffinity: "soft"
      nodeSelector: {}
      tolerations: {}
      readinessProbe:
        tcpSocket:
          port: 9200
        initialDelaySeconds: 60
        periodSeconds: 30
    data:
      terminationGracePeriodSeconds: 3600
      antiAffinity: "soft"
      nodeSelector: {}
      tolerations: {}
      podAnnotations: {}
      readinessProbe:
        tcpSocket:
          port: 9200
        initialDelaySeconds: 10
        periodSeconds: 30
    data-hot:
      terminationGracePeriodSeconds: 3600
      antiAffinity: "soft"
      nodeSelector: {}
      tolerations: {}
      podAnnotations: {}
      readinessProbe:
        tcpSocket:
          port: 9200
        initialDelaySeconds: 10
        periodSeconds: 30
    data-warm:
      terminationGracePeriodSeconds: 3600
      antiAffinity: "soft"
      nodeSelector: {}
      tolerations: {}
      podAnnotations: {}
      readinessProbe:
        tcpSocket:
          port: 9200
        initialDelaySeconds: 10
        periodSeconds: 30
    data-cold:
      terminationGracePeriodSeconds: 3600
      antiAffinity: "soft"
      nodeSelector: {}
      tolerations: {}
      podAnnotations: {}
      readinessProbe:
        tcpSocket:
          port: 9200
        initialDelaySeconds: 10
        periodSeconds: 30

kibana:
  tolerations: []

elasticsearchExporter:
  tolerations: []

fluentd:
  selinux:
    label: "s0:c170,c441"
elasticsearch:
  nodeGroups:
    master:
      persistence:
        enabled: true
        accessMode: ReadWriteOnce
        name: data
        size: "4Gi"
        storageClass: "kublr-system"
        # If 'hostPath' has truthy value (and 'persistence.enabled' is true), ES will use hostPath volumes to store data.
        # If 'hostPath' is not set (and 'persistence.enabled' is true), ES will use PVC to store data.
        hostPath:
    client:
      persistence: null
    data:
      persistence:
        enabled: true
        accessMode: ReadWriteOnce
        name: data
        size: "128Gi"
        storageClass: "kublr-system"
        hostPath:
    data-hot:
      persistence:
        enabled: true
        accessMode: ReadWriteOnce
        name: data
        size: "32Gi"
        storageClass: "kublr-system"
        hostPath:
    data-warm:
      persistence:
        enabled: true
        accessMode: ReadWriteOnce
        name: data
        size: "64Gi"
        storageClass: "kublr-system"
        hostPath:
    data-cold:
      persistence:
        enabled: true
        accessMode: ReadWriteOnce
        name: data
        size: "128Gi"
        storageClass: "kublr-system"
        hostPath:

#RabbitMQ used for central logging
rabbitmq:
  persistentVolume:
    enabled: false
    size: 3Gi
    accessModes:
      - ReadWriteOnce
    storageClass: "kublr-system"
# if createLoggingPriorityClasses is disabled, then need to override all priorityClassName values
# in the spec below (11 times)
# it can be empty value or 'kublr-default'
createLoggingPriorityClasses: true
# priorityClassName for logging-controller, logstash, sg-gen-cert-job, sg-gen-cert-job-cleanup
priorityClassName: kublr-logging-default-100

# default PSP for pods which do not require special permissions
podSecurityPolicy: 'restricted-psp'

elasticsearch:
  nodeGroups:
    master:
      priorityClassName: kublr-logging-default-100
    client:
      priorityClassName: kublr-logging-low-90
    data:
      priorityClassName: kublr-logging-default-100
    data-hot:
      priorityClassName: kublr-logging-default-100
    data-warm:
      priorityClassName: kublr-logging-default-100
    data-cold:
      priorityClassName: kublr-logging-default-100

#RabbitMQ used for central logging
rabbitmq:
  priorityClassName: kublr-logging-high-100000
  exporterPriorityClassName: kublr-logging-default-100

kibana:
  priorityClassName: kublr-logging-low-90

elasticsearchExporter:
  priorityClassName: kublr-logging-default-100

fluentd:
  priorityClassName: kublr-logging-high-100000
# a name of a secret used to pull images
imagePullSecretName: ""

global:
  keycloak:
    init:
      enabled: false
      image:
        registry: {{DOCKER_REPO_URL}}
        name: kublr/keycloak-init
        tag: '{{KUBLR_KEYCLOAK_INIT_VERSION}}'
    proxy:
      image:
        registry: quay.io
        name: keycloak/keycloak-gatekeeper
        tag: 10.0.0
      resources:
        limits:
          memory: 96Mi
        requests:
          cpu: 10m
          memory: 96Mi
  nginx:
    proxy:
      image:
        registry: docker.io
        name: nginxinc/nginx-unprivileged
        tag: 1.17-alpine
      resources:
        requests:
          cpu: 50m
          memory: 32Mi
        limits:
          memory: 128Mi

centralLogging:
  controlplane:
    controller:
      image:
        dockerRegistry: {{DOCKER_REPO_URL}}
        name: {{COMPONENT_GROUP}}/logging-controller
        tag: "{{COMPONENT_VERSION}}"
        pullPolicy: IfNotPresent
      resources:
        limits:
          memory: 192Mi
        requests:
          cpu: 100m
          memory: 128Mi
    logsMoverApp:
      image:
        dockerRegistry: {{DOCKER_REPO_URL}}
        name: {{COMPONENT_GROUP}}/logs-mover-app
        tag: "{{COMPONENT_VERSION}}"
        pullPolicy: IfNotPresent
      resources:
        limits:
          memory: 128Mi
        requests:
          cpu: 100m
          memory: 32Mi

searchguard:
  certGenerator:
    image:
      registry: {{DOCKER_REPO_URL}}
      name: kublr/sg_cert_generator
      tag: "{{SG_ELK_VERSION}}"
      pullPolicy: "IfNotPresent"
    resources:
      limits:
        memory: 256Mi
      requests:
        cpu: 100m
        memory: 256Mi
  elasticsearch:
    image:
      registry: {{DOCKER_REPO_URL}}
      tag: "{{SG_ELK_VERSION}}"
      # image name calculated in _helpers.tpl depends of elasticsearch.xpackEnabled and searchguard.enabled
      name:
  kibana:
    image:
      registry: {{DOCKER_REPO_URL}}
      tag: "{{SG_ELK_VERSION}}"
      # image name calculated in _helpers.tpl depends of elasticsearch.xpackEnabled and searchguard.enabled
      name:
  authProxy:
    image:
      registry: {{DOCKER_REPO_URL}}
      name: kublr/searchguard-auth-proxy
      tag: {{COMPONENT_VERSION}}
      pullPolicy: "IfNotPresent"

elasticsearch:
  image:
    registry: docker.elastic.co
    tag: "{{ELK_VERSION}}"
    pullPolicy: "IfNotPresent"
    # image name calculated in _helpers.tpl depends of elasticsearch.xpackEnabled and searchguard.enabled
    name:
  initContainerImage:
    registry: docker.io
    name: kublr/alpine-plus
    tag: '3.11-1'
    pullPolicy: IfNotPresent

  nodeGroups:
    master:
      heapSize: "512m"
      resources:
        limits:
          memory: "1024Mi"
        requests:
          cpu: "25m"
          memory: "1024Mi"
    client:
      heapSize: "1280m"
      resources:
        limits:
          memory: "2048Mi"
        requests:
          cpu: "25m"
          memory: "2048Mi"
    data:
      heapSize: "3072m"
      resources:
        limits:
          memory: "4096Mi"
        requests:
          cpu: "25m"
          memory: "4096Mi"
    data-hot:
      heapSize: "3072m"
      resources:
        limits:
          memory: "4096Mi"
        requests:
          cpu: "25m"
          memory: "4096Mi"
    data-warm:
      heapSize: "3072m"
      resources:
        limits:
          memory: "4096Mi"
        requests:
          cpu: "25m"
          memory: "4096Mi"
    data-cold:
      heapSize: "3072m"
      resources:
        limits:
          memory: "4096Mi"
        requests:
          cpu: "25m"
          memory: "4096Mi"


#RabbitMQ used for central logging
rabbitmq:
  image:
    tag: 3.8.11 # don't forget to update rabbit_version in rabbitmqDefinitions
    pullPolicy: IfNotPresent
  exporter:
    image:
      tag: v1.0-beta
  resources:
    requests:
      cpu: 500m
      memory: 1024Mi
    limits:
      cpu: 500m
      memory: 1024Mi

kibana:
  image:
    registry: docker.elastic.co
    tag: {{ELK_VERSION}}
    pullPolicy: IfNotPresent
    # default image name is calculated in _helpers.tpl depends on
    # elasticsearch.xpackEnabled and searchguard.enabled
    name:

elasticsearchExporter:
  image:
    registry: docker.io
    name: justwatch/elasticsearch_exporter
    tag: 1.0.4rc1
    pullPolicy: IfNotPresent

fluentd:
  image:
    registry: docker.io
    name: kublr/fluentd
    tag: 2.7.1
    pullPolicy: IfNotPresent
  initContainerImage:
    registry: docker.io
    name: kublr/alpine-plus
    tag: '3.11-1'
    pullPolicy: IfNotPresent

logstash:
  image:
    registry: docker.elastic.co
    tag: {{ELK_VERSION}}
    pullPolicy: IfNotPresent
    # default image name is calculated in _helpers.tpl as `logstash/logstash` or
    # `logstash/logstash-oss` and depends on searchguard.enabled
    name:

logstashExporter:
  image:
    registry: docker.io
    name: alxrem/prometheus-logstash-exporter
    tag: latest
    pullPolicy: IfNotPresent
  resources:
    limits:
      memory: 24Mi
    requests:
      cpu: 5m
      memory: 16Mi

curlImage:
  registry: docker.io
  name: kublr/alpine-plus
  tag: '3.11-1'
  pullPolicy: IfNotPresent

# elasticsearch curator parameters
curator:
  image:
    registry: docker.io
    name: kublr/curator
    tag: 5.8.1
    pullPolicy: IfNotPresent

# resources allocated for various components
resources:
  # Elasticsearch resources should be specified in elasticsearch client, data and master sections
  elasticsearchExporter:
    requests:
      cpu: 5m
      memory: 48Mi
    limits:
      memory: 48Mi
  # Kibana memory limit MUST be at least 1.5G because on start it builds UI artifacts and will fail if limit is set to
  # lower value. After initial build (whic usually takes ~2 minutes) memory usage goes down.
  # Minimal Kibana memory usage is normally ~700Mb-800Mb (in low intensity usage scenario with few users).
  kibana:
    requests:
      cpu: 200m
      memory: 2Gi
    limits:
      memory: 2Gi
  fluentd:
    requests:
      cpu: 150m
      memory: 128Mi
    limits:
      memory: 512Mi
  curator:
    requests:
      cpu: 100m
      memory: 256Mi
    limits:
      memory: 384Mi
  logstash:
    requests:
      cpu: 500m
      memory: 1230Mi
    limits:
      memory: 1230Mi
centralLogging:
  # if centralLogging.enabled then fluentd will send logs to local rabbitmq in additional to elasticsearch
  enabled: false
  # clustername will be sent as part of log payload and available to use in elasticsearch/kibana
  clusterName:
  # controlplane.enabled is set to true when the helm package is installed as a part of
  # the Kublr Control Plane and needs to deploy logstash to link rabbitmq and elasticsearch
  controlplane:
    enabled: false
    controller:
      service:
        type: 'ClusterIP'
        internalPort: 8080
        externalPort: 8080
      authentication:
        enabled: false
      config:
        authEndpoint: "https://{{ .Release.Name }}-keycloak-http:8443"
        auth:
          realm: kublr-ui
          clientId: 'logging-controller'
          type: 'jwt'
          username: ''
          password: ''
        centralizedLoggingUpdateInterval: '3m'
        centralizedLoggingErrorsCheckInterval: '10m'
    logsMoverApp:
      authentication:
        enabled: false
      config:
        port: '9108'
        authEndpoint: "https://{{ .Release.Name }}-keycloak-http:8443"
        authRealm: 'kublr-ui'
        authClientId: 'logging-controller'
        authType: 'jwt'
        authUsername: ''
        authPassword: ''

searchguard:
  enabled: false
  authProxy:
    config:
      apiEndpoint: http://kcp-kublr-kublr-api.kublr:8080

elasticsearch:
  enabled: true
  nameOverride: "elasticsearch"
  #appVersion is used in some templates to enable some configurations. Only major version takes into account
  appVersion: "{{ELK_VERSION}}"
  processors: 2
  cluster:
    name: "elasticsearch"
    kubernetesDomain:
    # DEPRECATED, use elasticsearch.xpackEnabled
    xpackIncluded: false
  numberOfReplicas: 0

  nodeGroups:
    master:
      exposeHttp: false
      nodeName:
    client:
      rolesOverride: "ingest"
      serviceType: ClusterIP
      exposeHttp: true
    data:
      rolesOverride: ""
      nodeName:
      exposeHttp: false
    data-hot:
      nodeName:
      exposeHttp: false
    data-warm:
      nodeName:
      exposeHttp: false
    data-cold:
      nodeName:
      exposeHttp: false

#RabbitMQ used for central logging
rabbitmq:
  exporter:
    enabled: false
  rabbitmqExporterPort: 9419
  postStart:
    enabled: false
  createClientUser: true
  rabbitmqDefinitions: |
    {
      "rabbit_version": "3.8.11",
      "vhosts": [
        {
          "name": "/"
        }
      ],
      "queues": [
        {
          "name": "from_fanout",
          "vhost": "/",
          "durable": true,
          "auto_delete": false,
          "arguments": {
           }
        }
      ],
      "bindings": [
        {
          "source": "amq.fanout",
          "vhost": "/",
          "destination": "from_fanout",
          "destination_type": "queue",
          "routing_key": "",
          "arguments": {
          }
        }
      ]
    }

# The cluserSpace parameter is set by the operator when the feature is deployed to the cluster. For the platform, this will be "kublr-system", for the cluster in the "dev" space, respectively, "dev".
clusterSpace: default

# If kubernetesApi is specified, the package will be able to configure Kibana UI access via Kubernetes proxy API
kubernetesApiEndpoint:

kibana:
  ingress:
    enabled: false
    domain:
    path: /
    rewriteTarget: |
      rewrite "(?i)/(.*)" /$1 break;
      rewrite "(?i)$" / break;
  service: {}
  authentication:
    enabled: false
    oidc:
      enabled: false
      authUrl: "https://{{ .Release.Name }}-keycloak-http:8443"
      realm: "kublr-ui"
      clientId: "logging-kibana"
      userRole: "user"
      adminRole: "admin"

logstash:
  service: {}
Internal Search Guard users registered by Kublr include:
admin with backend role adminsystem.logstash with backend role system.logstashsystem.kibanaserversystem.exporterCertificate-authenticated clients:
sgadmin: dn: CN=sgadmin,O=kublr (admin)logstash: dn: CN=system.logstash,O=kublrkibana: dn: CN=system.kibanaserver,O=kublrexporter: dn: CN=system.exporter,O=kublrcurator: dn: CN=system.curator,O=kublrhooks: dn: CN=system.hooks,O=kublrCertificate-authenticated nodes:
node: dn: CN=node,O=kublrPer-space role mappings:
kublr:{space-name}:
  backend_roles:
  - kublr:{space-name}
Common role mappings:
    sg_kublr_logstash:
      backend_roles:
      - "system.logstash"
      users:
      - "system.logstash"
    sg_kublr_kibana_user:
      backend_roles:
      - "kibanauser"
      - "user"
    kublr:kublr-system:
      backend_roles:
      - "kublr:kublr-system"
    sg_curator:
      users:
      - "system.curator"
    sg_hooks:
      users:
      - "system.hooks"
    sg_monitor:
      users:
      - "system.exporter"
    SGS_KIBANA_SERVER:
      users:
      - "system.kibanaserver"
    SGS_KIBANA_USER:
      backend_roles:
      - "kibanauser"
      - "user"
    SGS_LOGSTASH:
      backend_roles:
      - "system.logstash"
      users:
      - "system.logstash"
    SGS_ALL_ACCESS:
      backend_roles:
      - "admin"
Per-cluster roles:
kublr:{space-name}:
  index_permissions:
  - index_patterns:
    - 'kublr_{space-name}_{cluster-name}*'
    allowed_actions:
    - SGS_READ
Common roles:
sg_kublr_kibana_user:
  cluster_permissions:
  - SGS_CLUSTER_MONITOR
  index_permissions:
  - index_patterns:
    - "*"
    allowed_actions:
    - "indices:data/read/xpack/rollup*"
    - "indices:admin/mappings/get*"
    - "indices:admin/get"
    - "indices:data/read/field_caps*"
    - SGS_INDICES_MONITOR

sg_curator:
  cluster_permissions:
  - SGS_CLUSTER_MONITOR
  - SGS_CLUSTER_COMPOSITE_OPS_RO
  index_permissions:
  - allowed_actions:
    - SGS_INDICES_MONITOR
    index_patterns:
    - "*"
  - allowed_actions:
    - SGS_DELETE
    - "indices:admin/delete"
    index_patterns:
    - "kublr_*"
sg_hooks:
  cluster_permissions:
  - "cluster:admin/settings/*"
  - "cluster:monitor/health"
  - SGS_CLUSTER_MONITOR
  - SGS_CLUSTER_COMPOSITE_OPS_RO
  index_permissions:
  - allowed_actions:
    - SGS_INDICES_MONITOR
    index_patterns:
    - "*"

sg_kublr_logstash:
  cluster_permissions:
  - SGS_CLUSTER_MONITOR
  - SGS_CLUSTER_COMPOSITE_OPS_RO
  - "indices:admin/template/get"
  - "indices:admin/template/put"
  - "indices:admin/auto_create"
  index_permissions:
  - allowed_actions:
    - "SGS_CRUD"
    - "SGS_CREATE_INDEX"
    - "SGS_MANAGE"
    index_patterns:
    - "kublr_*"

sg_monitor:
  cluster_permissions:
  - "cluster:admin/xpack/monitoring/*"
  - "cluster:admin/ingest/pipeline/put"
  - "cluster:admin/ingest/pipeline/get"
  - "indices:admin/template/get"
  - "indices:admin/template/put"
  - SGS_CLUSTER_MONITOR
  - SGS_CLUSTER_COMPOSITE_OPS_RO
  index_permissions:
  - allowed_actions:
    - "indices:data/read/field_caps"
    index_patterns:
    - "*"
  - allowed_actions:
    - SGS_READ
    index_patterns:
    - "?kibana*"
