Kibana is an open source analytics and visualization tool for the Elasticsearch data.
Kibana with single sign-on from Kublr provides convenient UI for accessing and searching log entries from all clusters. Kublr uses Kibana version 7.10.
For more information, see Kibana 7.10 documentation.
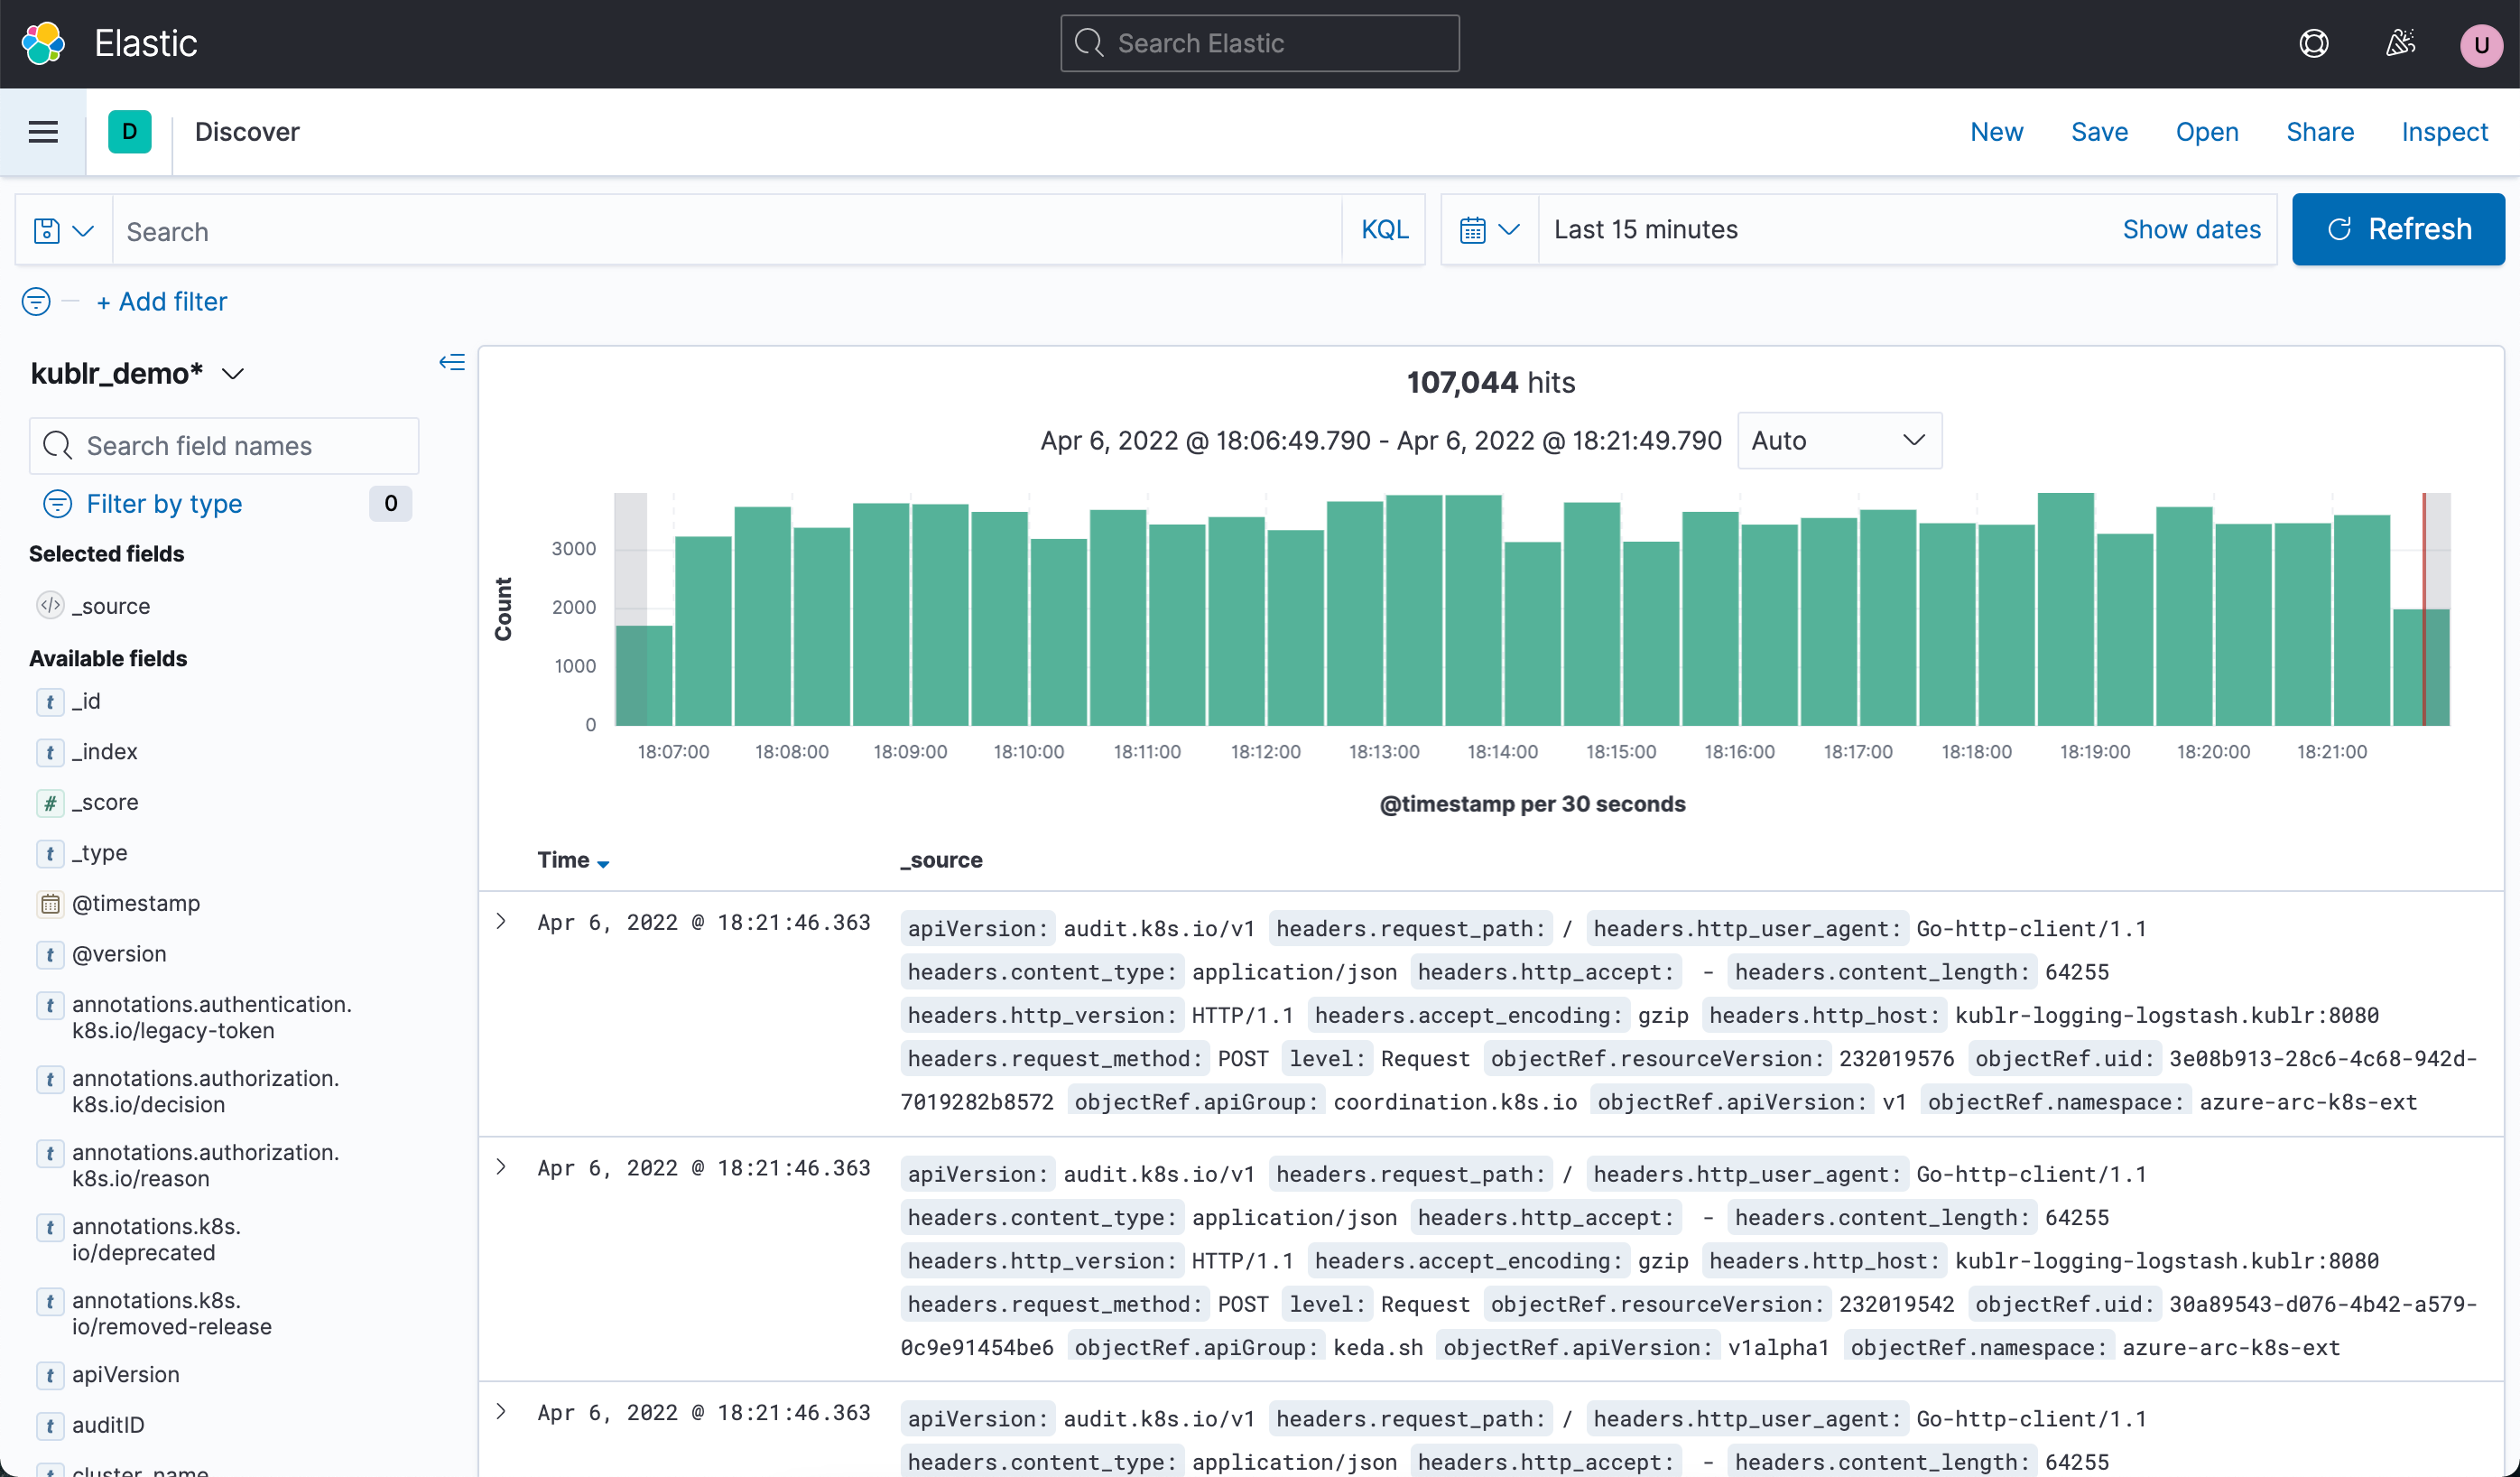
To analyze logs, the most useful is the Discover section of Kibana (on the picture above). This section is automatically opened when you navigate from Kublr to Kibana interface.
Useful features presented in this section are the following:
Read details about these features in the Discover section of the Kibana 7.10 documentation.
Open your platform.
On the left menu, click Centralized Logging.
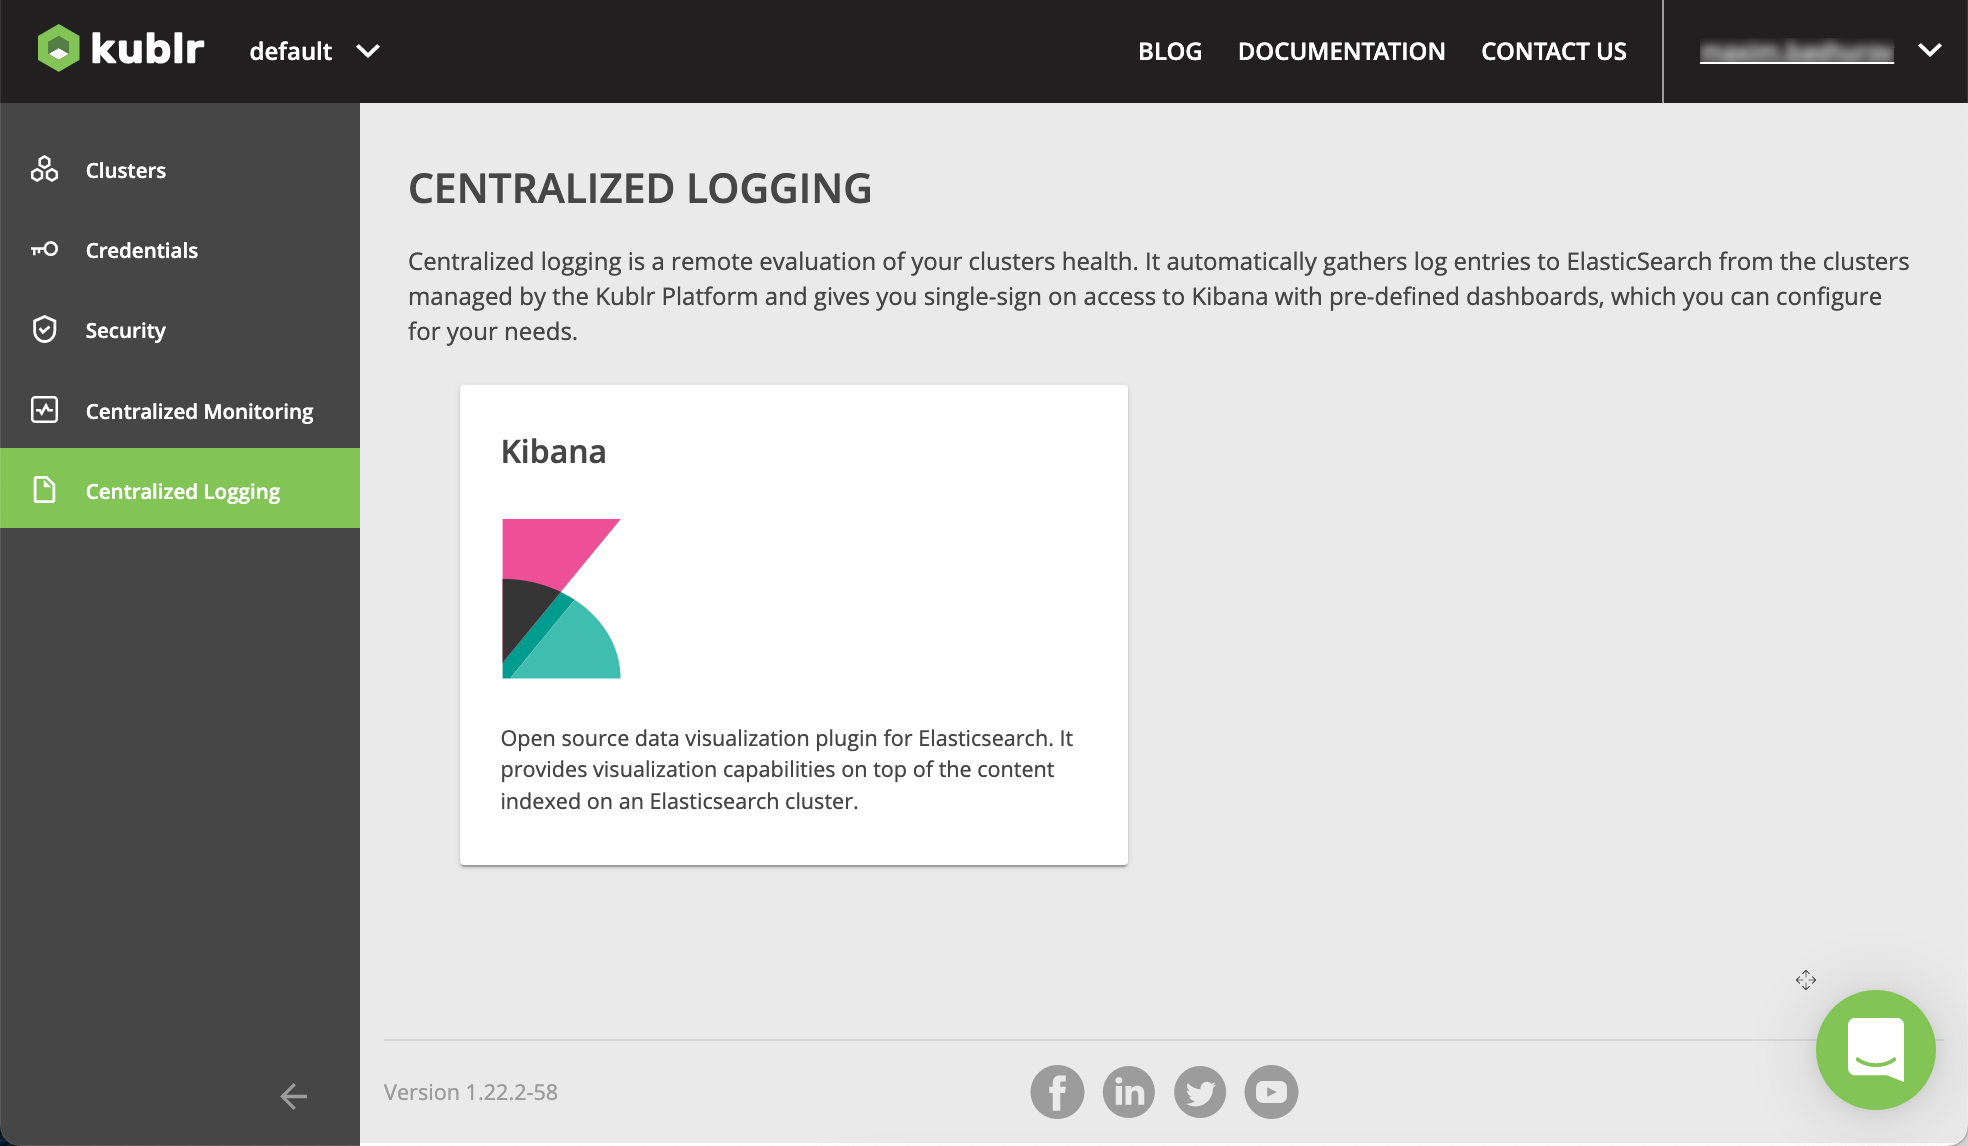
Click Kibana. In a new browser tab, Kibana interface is opened.
In Kibana, to analyze logs, use the Discover section.
Note Besides centralized logging on the platform level, you can enable the logging feature for the individual clusters with Kibana accessible as well.
Kibana requires an index pattern to access the Elasticsearch data that you want to explore. An index pattern selects the data to use and allows you to define properties of the fields.
Kublr provides a set of index patterns by default:
kublrkublr_default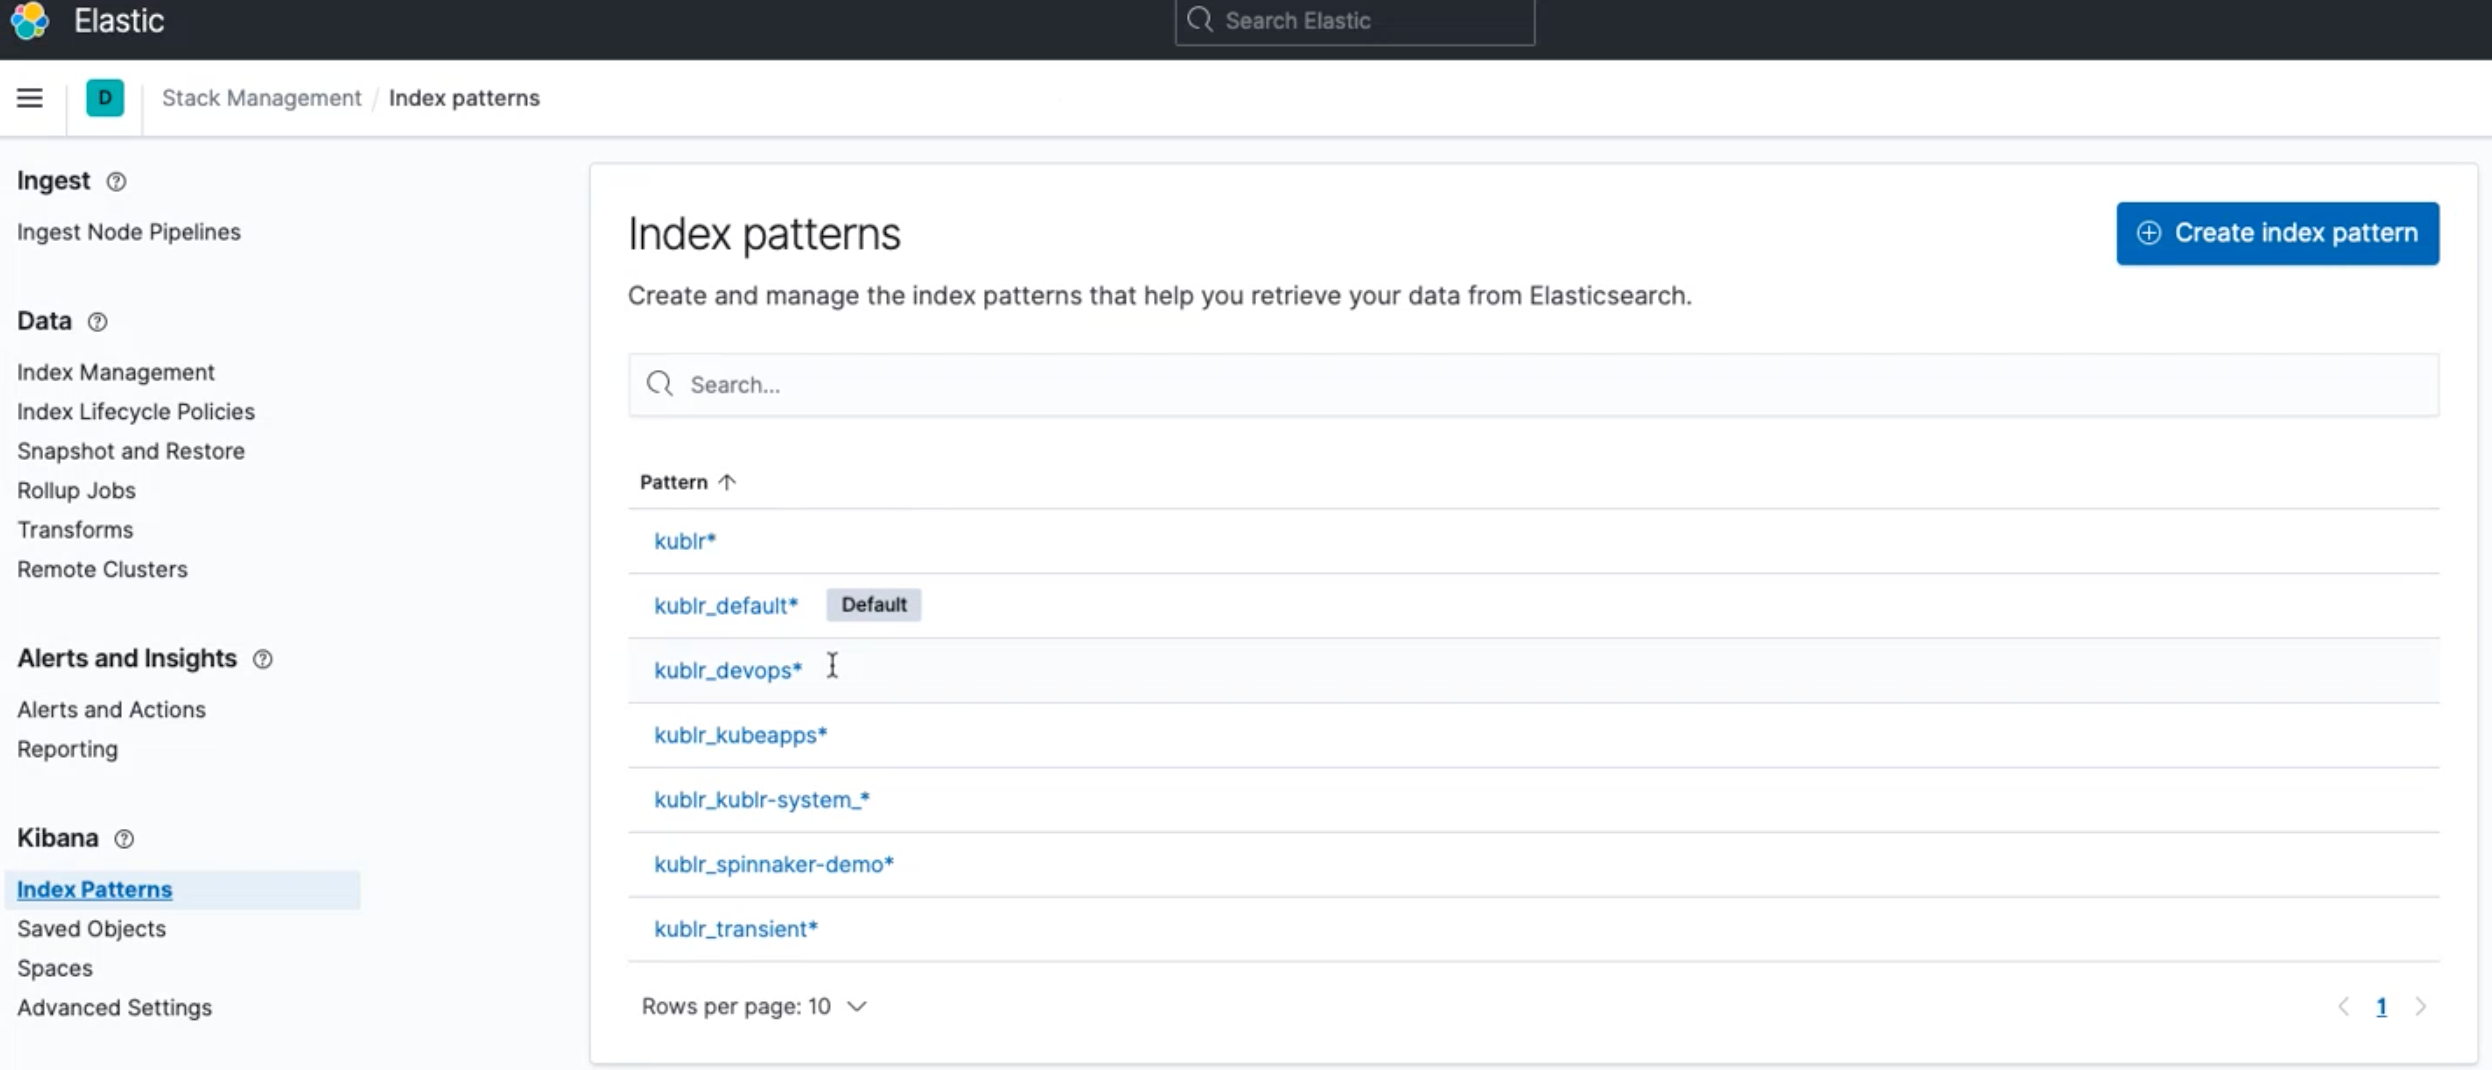
Additionally, you can create and configure your own index patterns.
Use Kibana search and filters to find required information in your logs. In the table below the search tips are based on the set of fields of the kublr index pattern:
| What to find | Search/filters |
|---|---|
| Node(s) operating system logs | tag: syslog |
| Kubernetes and its kube-system namespace | tag: audit |
| Kublr components | kubernetes.namespace_name: kublr + further filters using presented fields, especially kubernetea.labels.* fields (obtain the data to use during filtering from Kubernets dashboard, pods metadata information) |
| Logs by cluster | cluster_name: value |
| Logs by cluster node | kubernetes_node: value |
| Your custom application | kubernetes.labels.app: value or other approaches (see notes below) |
| Parsed from JSON (Fluent Bit enabled) |
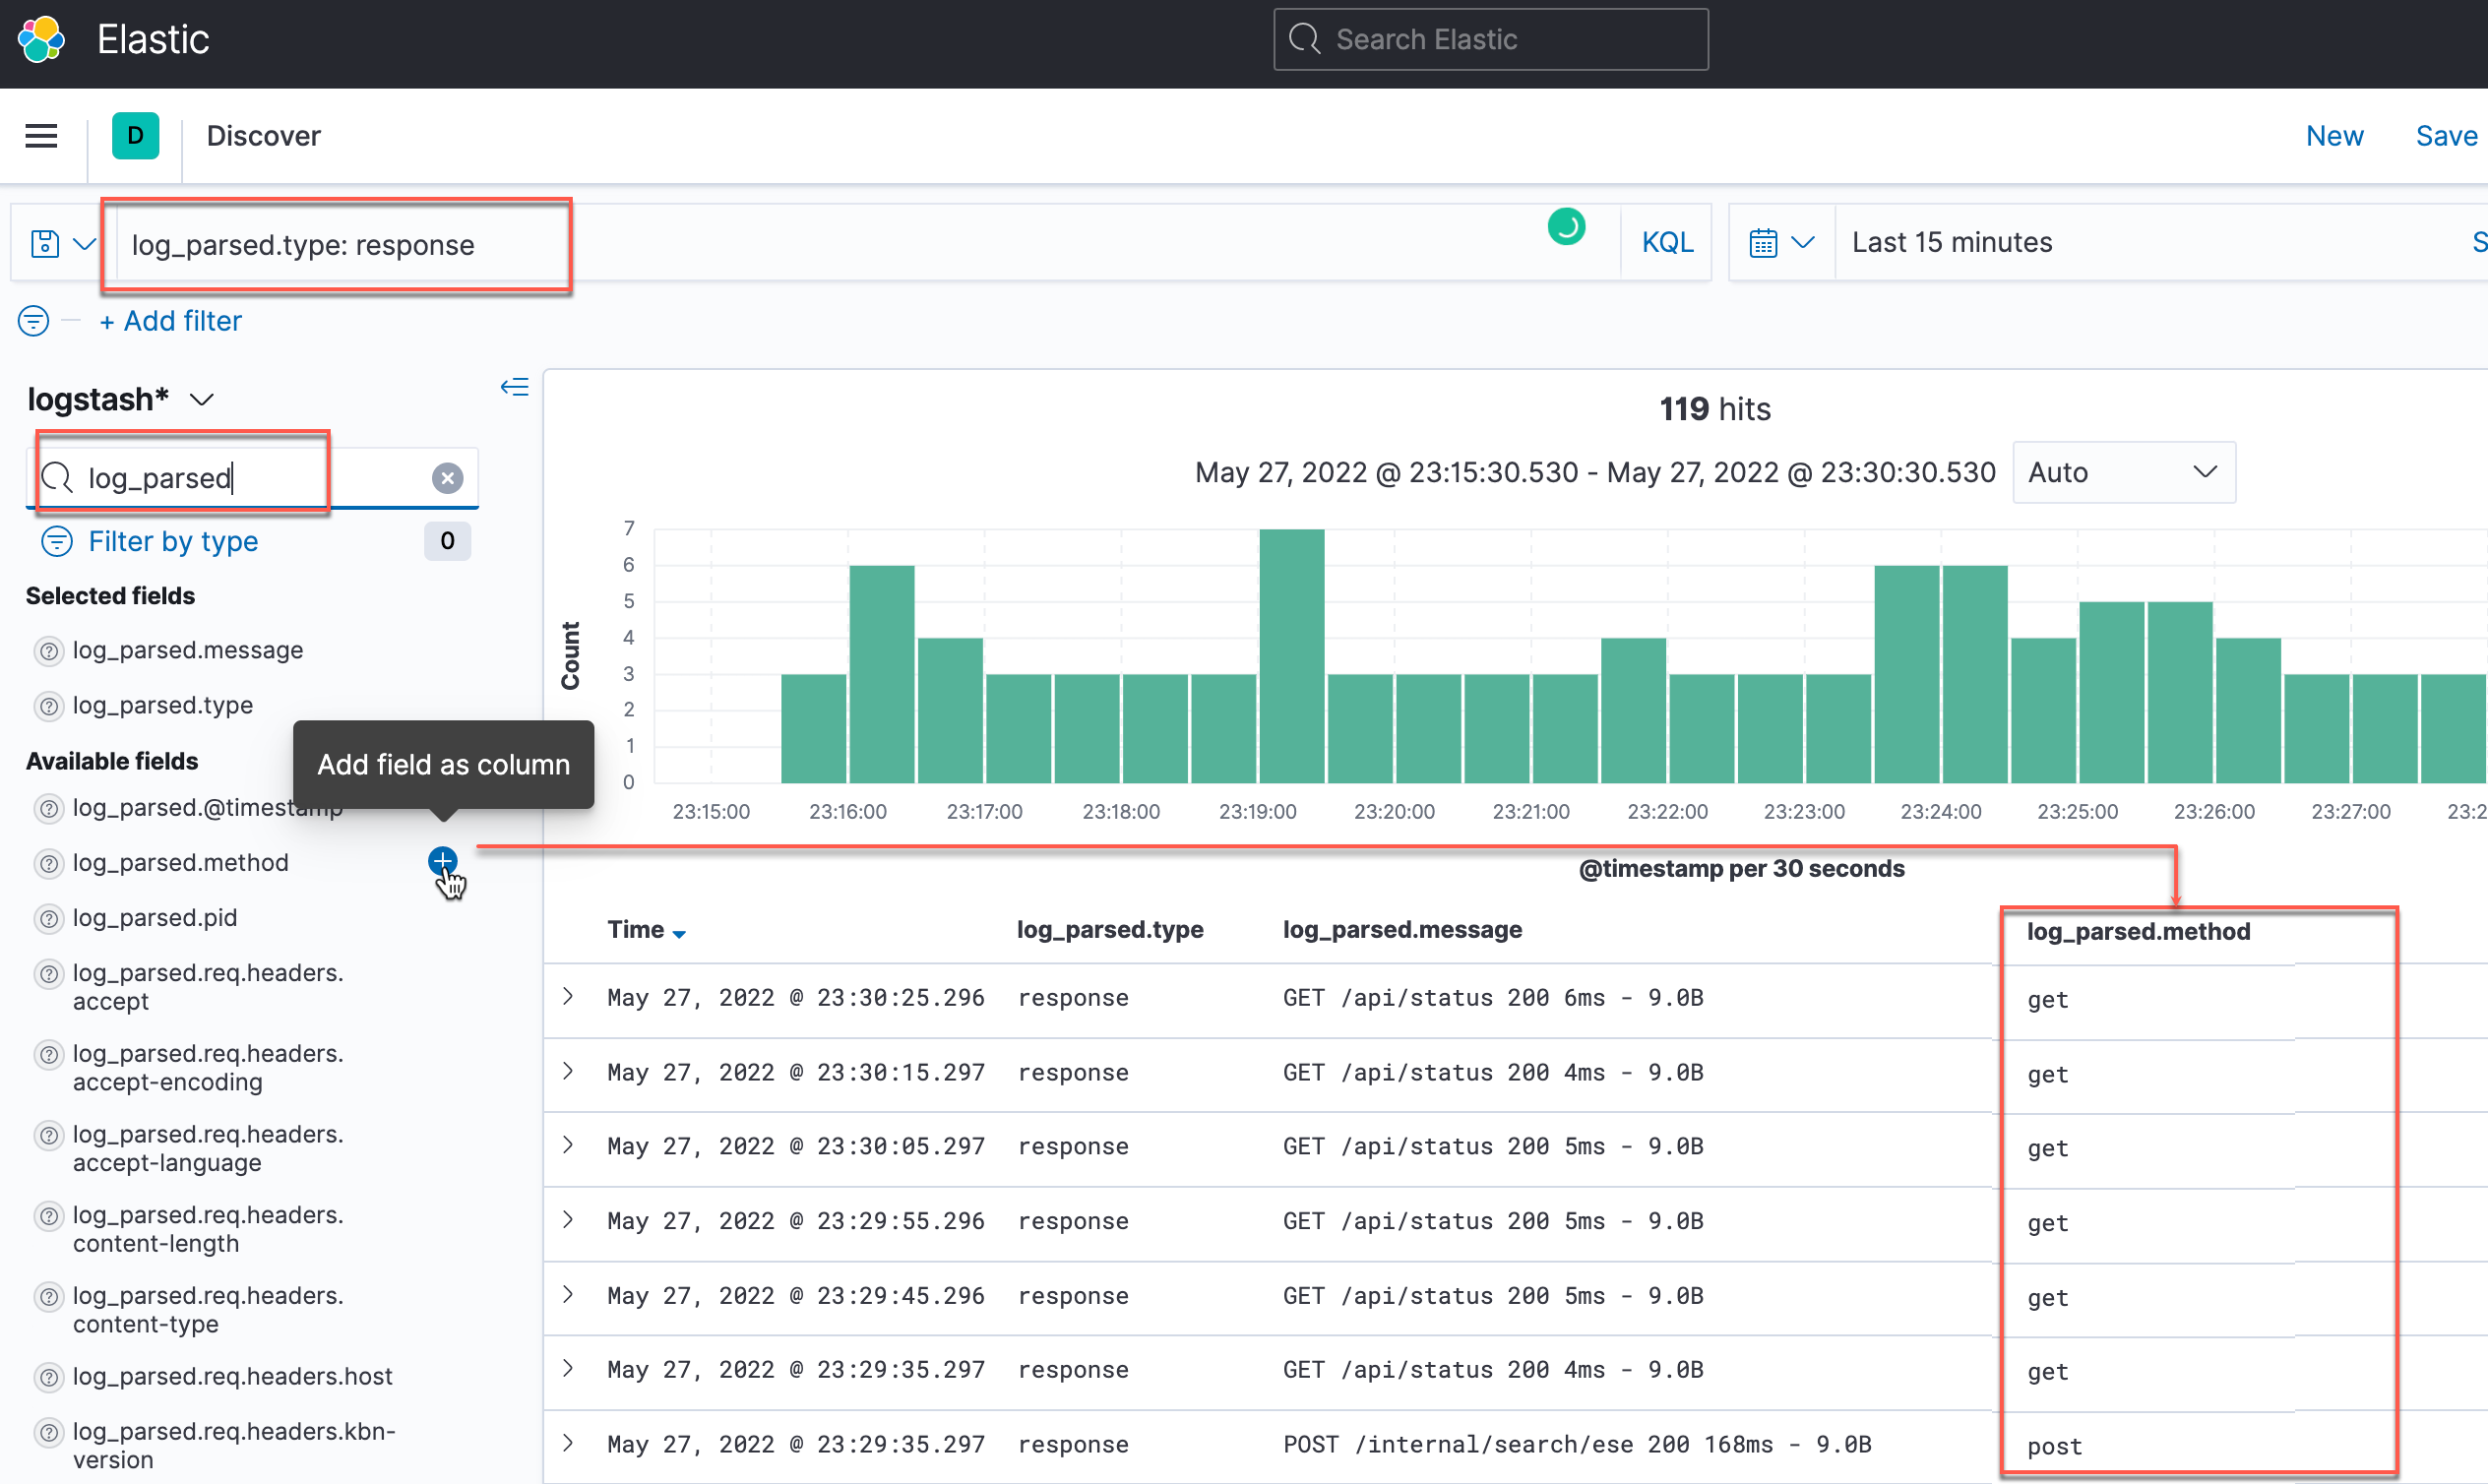 |
The indexes for the log entries are highly configurable. You can configure different aspects of indexes functioning, such as:
Below are the brief notes of how indexes may behave or be configured. That information may be useful both to the cluster administrators, and when searching log data in Kibana.
The indexes are:
Organized differently when using and not using DataStreams.
Example with DataStream:
.ds-kublr_kublr-system_kcp-demo_log-000002 where:
.ds-kublr_[space in Kublr]_[cluster name]_log-[order number caused by DS policy]
Example without DataStream:
kublr-system_kcp-demo-2022.04.18 where:
[index_name]-yyyy.MM.dd and [index_name] = [space in Kublr]_[cluster name]
BUT: [index_name] and other elements may be rewritten via the cluster configuration (may be performed via the specification in Kublr UI);
Configurable via cluster specification, for example:
elasticsearch:
kibana:
logstash:
    indexNamePrefix: kublr_%{[cluster_space]}_%{[cluster_name]}
    additionalConfig:
    filter {
        if [tag] == "audit" {
            mutate { update => { "[@metadata] [index_namel   => "kublr_%{[cluster_space]}_%{[cluster_name]}_audit" } }
        } else {
            mutate { update => ( " [@metadata] [index_name]" => "kublr_%{[cluster_space]}_%{[cluster_name]}_log" } }
        }
    }
header.* fields are auxiliary, added by the log mover Kublr component during data collection from the remote clusters. They are not related to any business application or Kubernetes itself.