The auditing feature of Kubernetes captures a time-ordered collection of records that document the series of actions taken within a cluster, which are essential for security purposes. It monitors user-generated activities, the Kubernetes API usage by applications, and the control plane’s actions.
By utilizing auditing, administrators of a cluster can address the following inquiries:
Correspondingly, when managing clusters with Kublr, audit logs are the key to finding events in an API server including data related to:
To access and view audit logs:
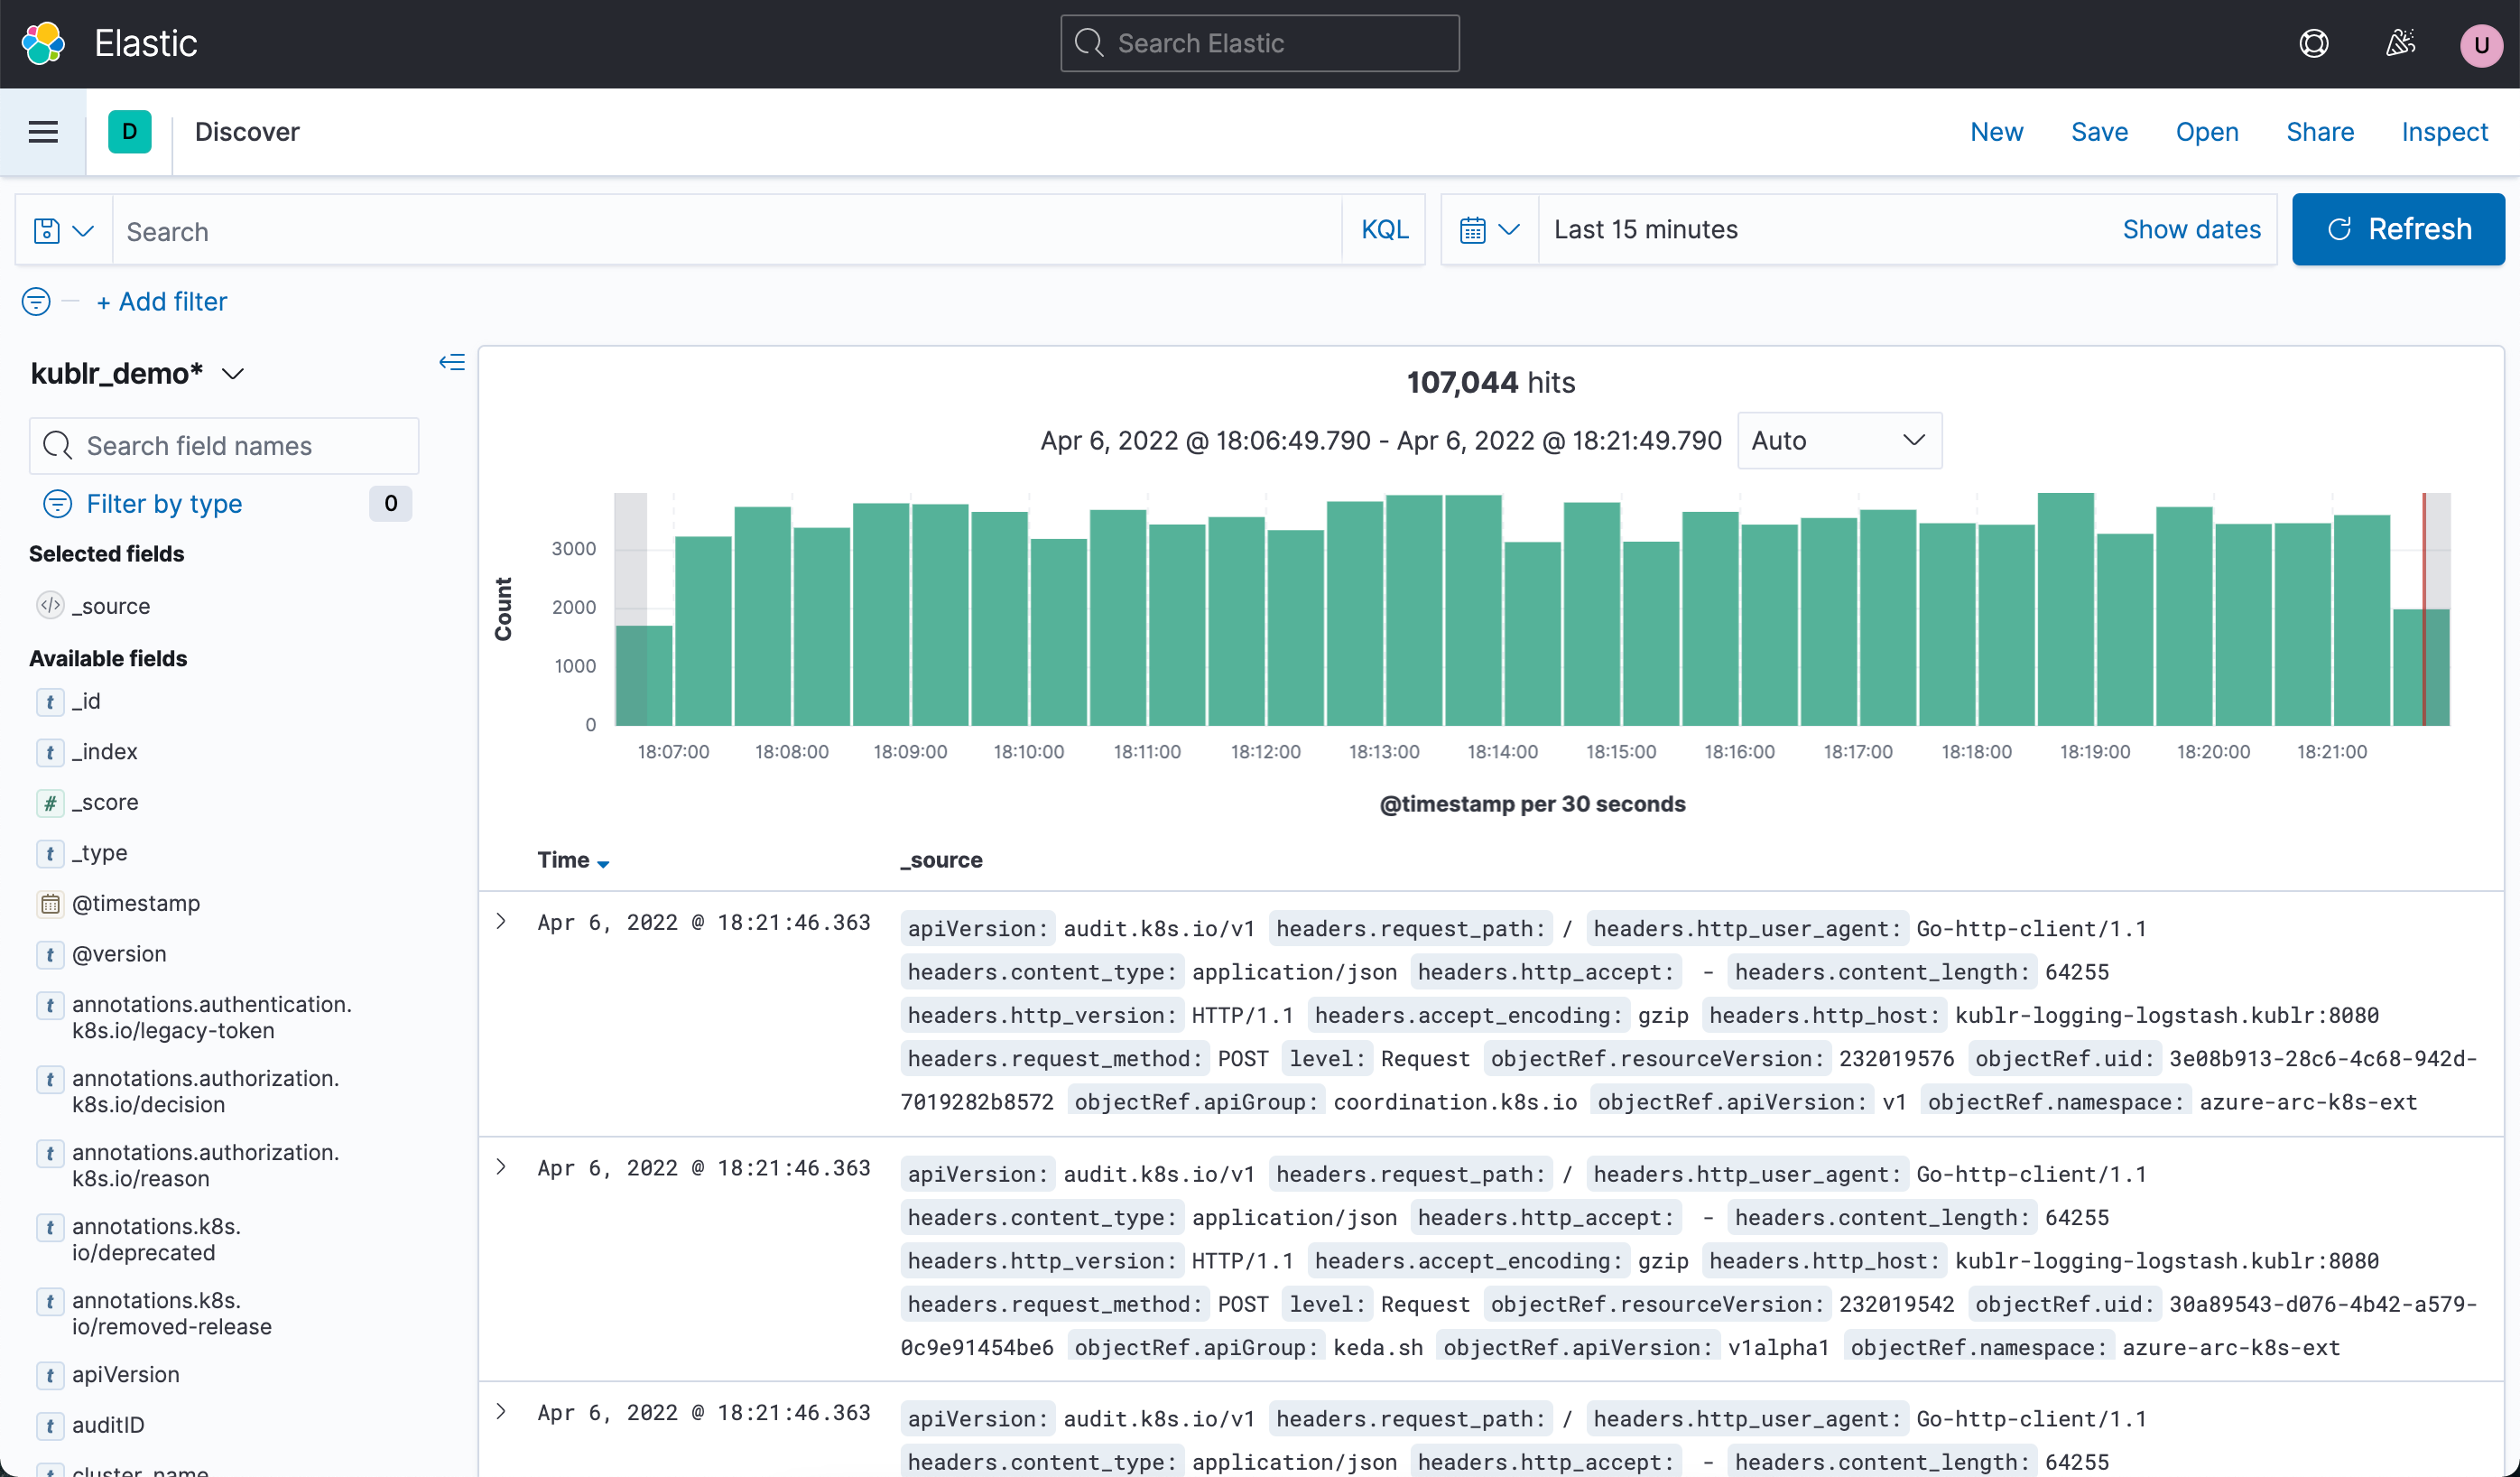
To know how to search for audit logs and among them, search for “audit” in the Working with logs in Kibana article. To know how the audit logging is configured by default in Kublr and how the default configuration can be changed, read the sections below.
Concepts: request stage, audit level, audit policy, rule.
Main article (Kubernetes documentation): Auditing
In Kubernetes, each request can be recorded with an associated request stage. The defined stages are:
RequestReceived - The stage for events generated as soon as the audit handler receives the request, and before it is delegated down the handler chain.ResponseStarted - Once the response headers are sent, but before the response body is sent. This stage is only generated for long-running requests (e.g. watch).ResponseComplete - The response body has been completed and no more bytes will be sent.Panic - Events generated when a panic occurred.What events should be recorded and what data they should include is defined by audit policy which is the set of rules. When an event is processed, it’s compared against the list of rules in order. The first matching rule sets the audit level of the event. The defined audit levels are:
None - don’t log events that match this rule.Metadata - log request metadata (requesting user, timestamp, resource, verb, etc.) but not request or response body.Request - log event metadata and request body but not response body. This does not apply for non-resource requests.RequestResponse - log event metadata, request and response bodies. This does not apply for non-resource requests.By default Kublr configures clusters to log all requests and response (level set to RequestResponse). This policy is passed within the audit-policy.yaml file.
Cluster specification:
spec:
  master:
    kublrAgentConfig:
      extensions:
        audit_policy:
          path: templates/cluster_config_dir/audit-policy.yaml
In Kublr and thus in the specification above, audit policy is declared as an extension. See extensions for more details.
Default audit-policy.yaml content:
apiVersion: audit.k8s.io/v1
kind: Policy
rules:
# Don't log read-only requests from the apiserver
- level: None
  users: ["system:apiserver"]
  verbs: ["get", "list", "watch"]
# Don't log kube-proxy watches
- level: None
  users: ["system:kube-proxy"]
  verbs: ["watch"]
  resources:
  - resources: ["endpoints", "services"]
# Don't log nodes getting their own status
- level: None
  userGroups: ["system:nodes"]
  verbs: ["get"]
  resources:
  - resources: ["nodes"]
# Don't log kube-controller-manager and kube-scheduler getting endpoints
- level: None
  users: ["system:unsecured"]
  namespaces: ["kube-system"]
  verbs: ["get"]
  resources:
  - resources: ["endpoints"]
# Default request log level is Matadata; for more information Request or RequestResponse can be used
- level: Metadata
  omitStages:
  - "RequestReceived"
In Kublr, you can configure cluster audit policy via specification.
For example:
spec:
  master:
    kublrAgentConfig:
      extensions:
        audit_policy:
          content: |
            # Log all requests and omitStages "RequestReceived"
            apiVersion: audit.k8s.io/v1
            kind: Policy
            rules:
            - level: Request
              omitStages:
              - "RequestReceived"
          path: templates/cluster_config_dir/audit-policy.yaml
On saving specification, the content section will override the content of the audit-policy.yaml and the new policy will come into action.
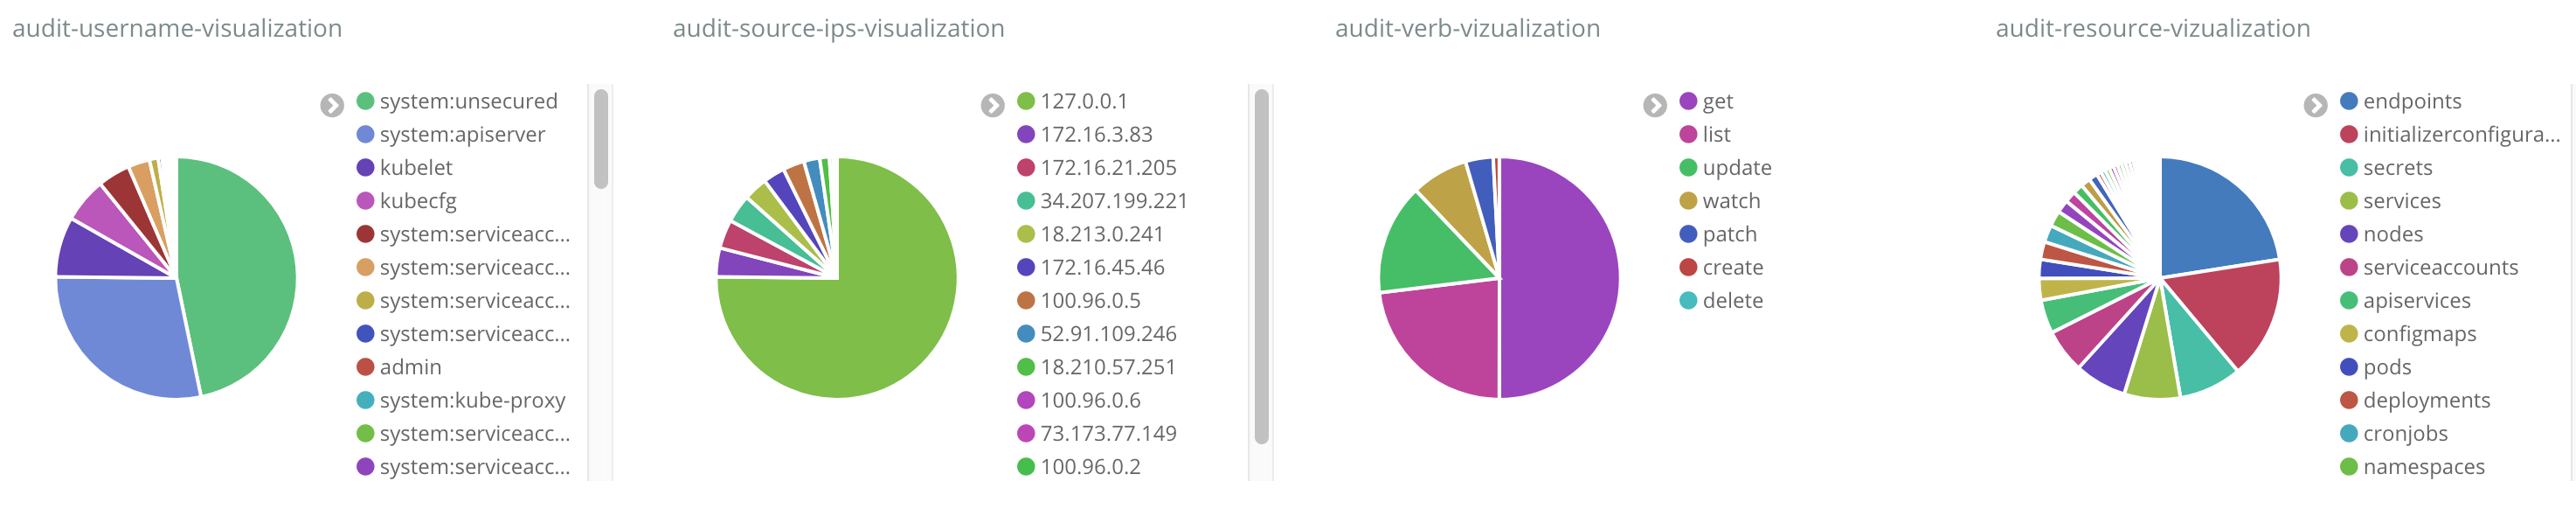
Audit dashboards may be created in self-hosted and centralized log collection Elasticsearch/Kibana stacks.
Download the audit dashboard file you need:
Open Kibana (click the link from the cluster’s overview page) and import the file with audit-dashboard:
Note: If you see import errors, you can try importing the dashboard again.
